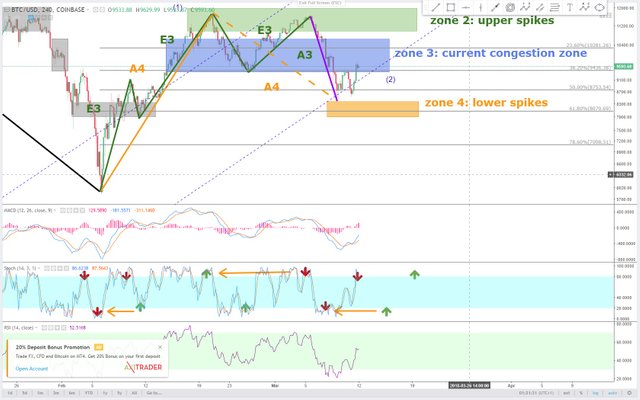
Bitcoin daily 11. mar the 4-hour stochastic
When the stochastic of the 4-hour chart is oversold next time, the price must not be seen in zone 4. This will indicate that a regressing orange trend section, marked as A4, has ended. It will also indicate that indermediate wave 2 is completed.
Description of the drawing usage:
All boxes in diagrams are congestion zones.
Grey boxes are congestion zones from the past. They are the footprints of a market. They act like magnets, making the price prone to revisit them, even in a bull market.
Present and possible future congestion zones are drawm as colored boxes.
Colored slanted lines are trend sections of various time frames.
Colored horizontal lines show when an equally colored trend section is completed for sure, once the price touches such a horizontal line. They are support and resistance levels.
Colored vertical lines which range from top to bottom of the chart mark the end of time frames. Once the price reaches them, an equally colored trend section must have completed already.
Time frames are shown as a scale of vertical lines on daily charts usually.

For future viewers: price of bitcoin at the moment of posting is 9587.50USD
Congratulations @heidelbaer! You have completed some achievement on Steemit and have been rewarded with new badge(s) :
Click on any badge to view your own Board of Honor on SteemitBoard.
For more information about SteemitBoard, click here
If you no longer want to receive notifications, reply to this comment with the word
STOP