SLC S21W5 : Advanced Strategies Using On-Chain Data and Sentiment Indicators
Hello everyone i hope you all are good and enjoy your life. i was busy and also not feeling well that's way i was absent from crypto academy contest but now I am excited to join Week 5 of Season 21 of the Steemit Learning chalenge where we are exploring Market Sentiment Analysis. This is about understanding how traders feel about the market whether they are confident or worried and how this affect price movement.
In this post I will look at tool like the Fear & Greed Index and on chain data such as Wallet activity and token transfer to figure out what they tell us about the market. using this information I will created a simple trading plan for the Steem/USDT market.
Question 1: Understanding On-Chain Data Metrics |
|---|
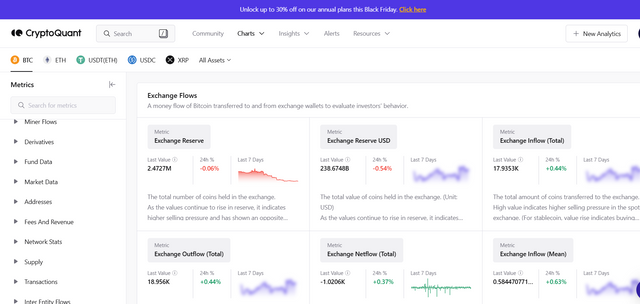
On chain data metrics are realy important because they provides us with real insight into what actualy hapening in the market. These metrics show us what peoples are doing with their token rather than just looking at the price or news reports. There are a few key on chain metric that can help us understand market sentiment especialy during bull run wallet activity exchange inflows and outflows and token holding distribution.
1. Wallet Activity
Wallet activity refers to the number of wallets that are actively making transactions like buying seling or transferring tokens. When there a lot of wallet activity it generally means that more people are getting involve in the markets.
- Example: Lets say there a increase in active wallets or transactions happening. This might suggest that more traders are entering the market because they think the price will keep going up. During a bull run we usualy see wallet activity increase because people are excited and are looking to buy or hold token in hopes of making profit as the price rise.
2. Exchange Inflows/Outflows
Exchange inflows and outflows show us how much cryptocurrency is moving into or out of exchanges. When tokens flow into exchange it typically means traders are getting ready to sell. When token flow out it usually means traders are holding onto their token.
- Example: During a bull run if we see a lot of tokens moving out of exchanges that’s often a good sign. It means people are holding their tokens in private wallet expecting the price to keep rising. If there were large inflows to exchange during a bull run it might suggest that people are preparing to sell which could mean the market is about to slow down or reverse.
3. Token Holding Distribution
Token holding distribution tells us how the token are spread out among different wallet addresses. If most tokens are held by a small number of wallet this could mean the market is being controlled by a few big players. But if the tokens are spread out more evenly it usually means the market is more stable and diverse.
- Example: If we see that more wallets are holding tokens during a bulls run that usualy a positive sign. It showsthat a wider group of people believe in the tokens and wanted to hold it for the long terms. But if only a few wallets are holding the majority of the tokens that coulds raise concerns because those big holder could sell their token anytime which could lead to sharp price drop.
How These Metrics Indicate Market Sentiment During a Bull Run
When we are in a bull run these on chain metrics help us figure out if the market sentiment is truly positive and sustainable or if it might be about to change.
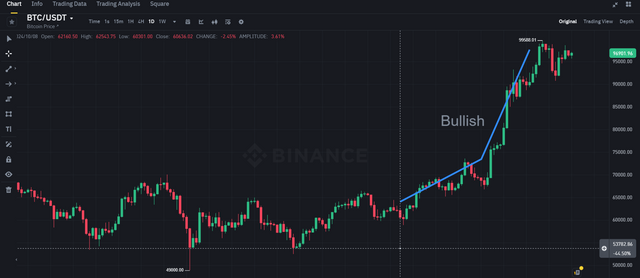
- Bullish Sentiment: If there more wallet activity tokens moving out of exchanges (showing people are holding) and a more balanced distribution of tokens its usually a sign that the market sentiment is genuinely bullish. This means a lot of people are confident about the price going higher and are staying in the market.
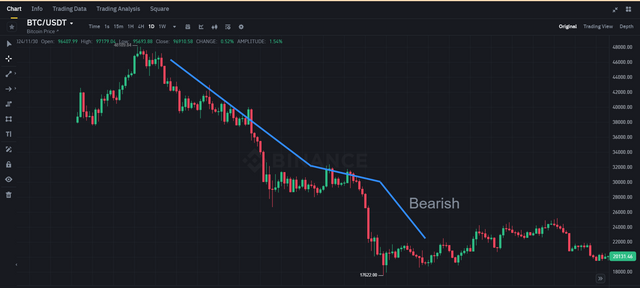
- Bearish Signs in a Bull Run: But if we see inflows to exchanges during a bull run or a few wallets holding most of the tokens it might indicate that some big players are getting ready to sell. This could mean that the bull run is nearing its end and prices might drop soon.
| On chain data metrics are really useful because they help us understand the real behavior of market participants. By looking at wallet activity exchange flows and token distribution we can get a better sense of market sentiment. During a bull run these metrics can help us figure out whether the markets is likely to keep going up or if there are signs that a correction is coming. understanding these signals can help us makes smarter decision as traders. |
|---|
Question 2: Using Sentiment Indicators to Analyze Market Trends |
|---|
Using Sentiment Indicators to Analyze Market Trends
Sentiment indicator are valuable tools for gauging the overall mood of the market Which can be critical in predicting bulish or bearish condition. These indicator provide insight into investor emotions which often drive price movement before technical or fundamental factor.
1. Fear & Greed Index:
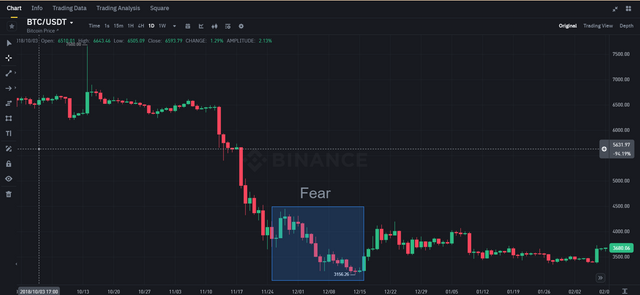
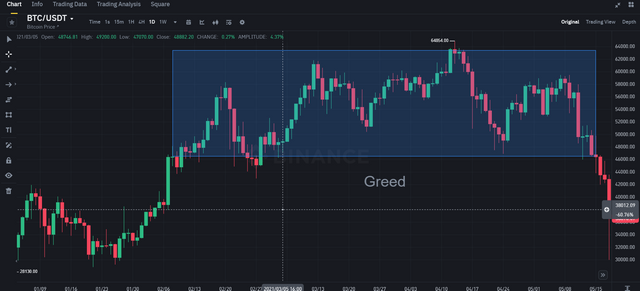
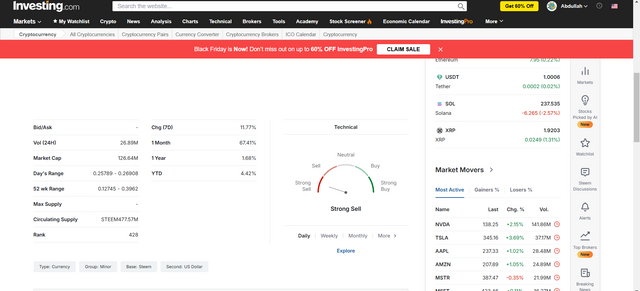
The Fear & Greed Index is one of the most popular sentiment indicator. It measure the level of fear or greed in the markets by analyzing factors such as price momentum volatility market volume and social media sentiment. A high level of greed often indicates that the market may be overheated and may be due for a corection whereas excessive fear may suggest an oversold market signaling potential buying oportunity.
.png)
.png)
Example of Predicting Reversals:
Historically when the Fear & Greed Index shows extreme fear it can mark a bottom for market. For instance during the crypto market sell off in 2018 extreme fear was seen when Bitcoin dropped below $4 000 Which ultimately signaled reversal as the markets started to recover. On the other hand periods of extreme greed such as during the 2021 bull run have historically preceded significant corrections.
2. Social Media Sentiment:
In the digital age social media platforms such as Twitter Reddit and even platforms like Telegram can offer real-time insights into market sentiment. Positive new about a certain cryptocurrency or tech trend can lead to a surge in buying activity while negative Sentiment can result in panic selling. sentiment analysis tools use natural language processing (NLP) to scan these platforms and gauge the overall mood of the market participants.
Example of Market Reaction:
A recent example of how sentiment indicators influenced market movements is the surge in crypto prices after President-elect Donald Trump’s crypto friendly stance became public. As news spread about his favorable outlook toward cryptocurrencie the market sentiment turned positive leading to bullish price action. In the days folowing the announcement several major cryptocurrencie including Bitcoin experience upward momentum With prices reflecting the optimism surrounding the new policy direction.
Analyzing the Recent Price Movements:
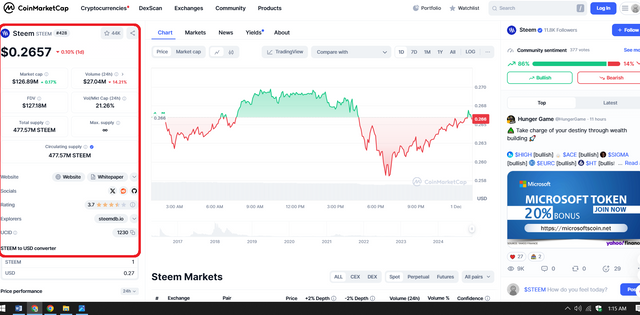
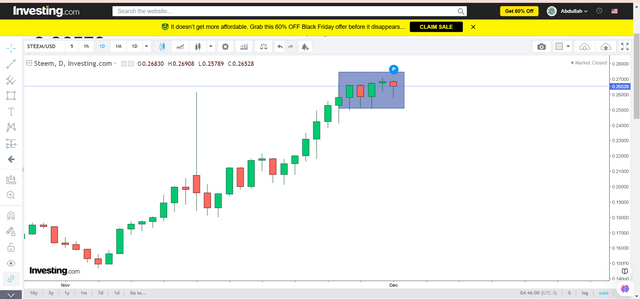
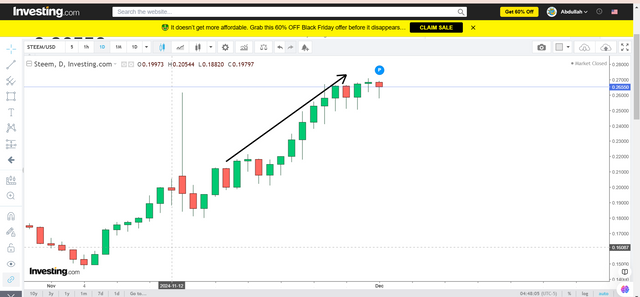
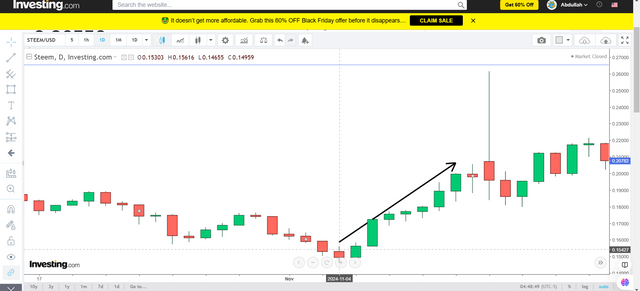
Looking at the price data from November 2024 we see some interesting trends that can be analyze using sentiment indicators
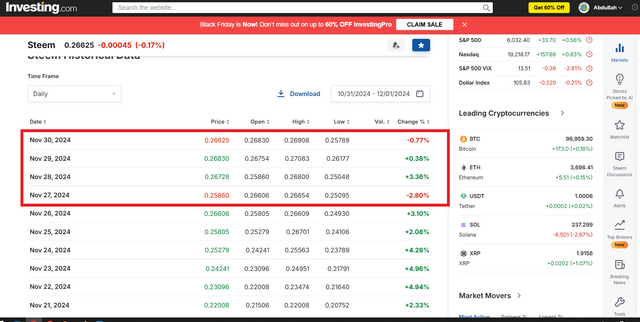
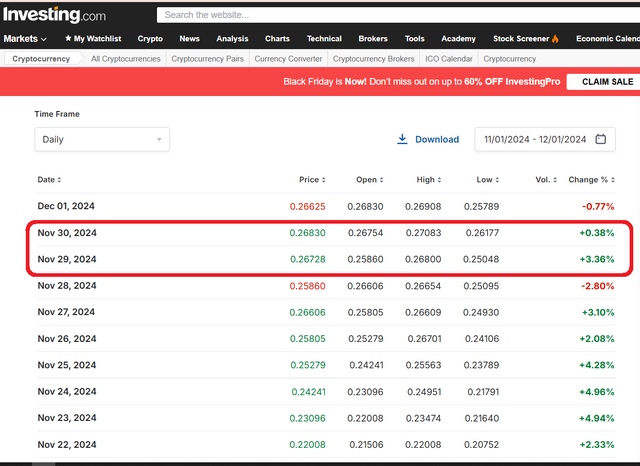
- On November 29 2024 the price of the asset increased by 3.36% following a recent low of 0.2586 on November 28. This rebound could be attribute to a changes in sentiment as the market began to show sign of optimism.
- Similarly on November 18 2024 we see a significant price increased of 8.65% possibly triggered by positive market sentiment or breaking new that impacted the broader market.
- On the other hand there are days where sentiment indicator could signal a reversals such as November 6 2024 when the price saw a sharp increase of 10.28% followed by a correction in the subsequent days reflecting an temporary market imbalance.
| sentiment indicators such as the Fear & Greed Index and social media sentiment provide essential information about market psychology. By analyzing these tools in combination with price data investors can gain insight into potential reversals and better understand the driving forces behind market movements. |
|---|
Question 3: Integrating On-Chain Data with Sentiment Indicators |
|---|
Integrating On-Chain Data with Sentiment Indicators
On chain data and sentiment indicator work together to provide a comprehensive picture of market sentiment enabling traders to makes informed decisions based on both quantitative and qualitative factor.
1. On Chain Data:
On-chain data provides insights into the behavior of blockchain participants. Key metrics include transaction volume wallet balance token flow and miner activity. These metrics allow traders to track actual movements and trends within the network offering grounded view of suply and demand dynamics. For instance if a large number of coins are being transferred from whale wallet to exchange it could signal impending seling pressure.
2. Sentiment Indicators:
Sentiment indicators on the other hand are derived from market sentiment usually from social media news outlets and trader activity. These include tool such as the Fear and Greed Index social sentiment analysis and trading activity on platforms likes Twitter and Reddit. These indicator reflect the emotional outlook of market participant which often drives short term price movement
Complementary Roles:
By combining on chain data with sentiment indicators trader gain a more complete understanding of market sentiment as both complement each other.
For example:
- If the price of Steem/USDT is steadily increasing but social sentiment is negative (e.g. a wave of negative news or community concern about a potential regulatory crackdown) on chain data can provide additional insights. A surge in token transfer to exchanges could confirm that the price rise is driven by speculative or short term selling activity rather than long term demand.
- Conversely if sentiment indicator show positive sentiment (e.g. increased discussions or positive news about Steem) and on-chain data reveals a significant number of tokens being held in long-term wallets this suggest strong confidence in the asset suporting the bullish sentiment.
Example Using Steem/USDT:
Consider the following price and volume data from the Steem/USDT pair
| Date | Price | Volume | Change % |
|---|---|---|---|
| 11/30/2024 | 0.26496 | -0.87% | |
| 11/29/2024 | 0.26728 | 3.36% | |
| 11/28/2024 | 0.2586 | -2.80% | |
| 11/27/2024 | 0.26606 | 3.10% |
If on chain data shows that large amounts of Steem are being transferred to exchanges during periods of price drops (e.g. 11/28/2024 with -2.80%) it may signal that investors are looking to sell. However sentiment indicators like social media chatter or news about Steemit’s developments could help confirmed whether this is driven by a short term fear factor or if there's underlying positive sentiment for the long term growth of Steem.
For instance:
- Positive Sentiment: On social media users may be discussing new platform features or upcoming partnership that could drive future growth suggesting that the price drop is a buying opportunity.
- Negative Sentiment: Negative news or rumors such as regulatory concerns could explain the price drop and on chain data showing movement to exchange might confirm a bearish trend.
In such a scenario integrating both data sources (price action on chain data and sentiment analysis) helps paint a clear picture of the market dynamics makes it easier to predict future movement.
| By combining on chain data which offers real-time verifiable metrics with sentiment indicators which capture emotional and psychological market tendencies trader can form a more complete view of markets sentiment. This dual approach not only helps confirm trends but also reveal potential contradictions (e.g. price rising despite negative sentiment) that could signal oportunities or risk. |
|---|
Question 4: Developing a Sentiment-Based Trading Strategy |
|---|
Sentiment Based Trading Strategy for Steem
A sentimen based trading strategy involve using market sentiment both from on chain data and sentiment indicator to make informed decisions on when to enter and exit trades. Below is a sentiment based trading strategy tailored to steem (STEEM) taking into account bullish and bearish sentiment phase.
1. Sentiment Indicators:
- On Chain Data:
- Price Action: Monitor the price trends (daily and weekly).
- Volume: Higher volume can indicate stronger conviction in price direction.
- Open Interest: Higher open interest may signal greater market participation.
- Price and Volume Correlation: significant moves in price alongside high volume sugest strong market sentiment.
- Sentiment Indicators (External):
- Social Media Sentiment: Track platforms like Twitter Reddit and Steemit communities. Positive mention a surge in social media engagement or influencers talking about Steem can suggest bullish sentiment.
- Sentiment Analysis Tools: Tools like "The Ticker Tape" or "Sentiment Analyzer" can help asses whether the sentiment is positive neutral or negative in relation to Steem.
- News: Positive or negative new surrounding steem or its ecosystem such as updates or partnerships can also affect sentiment.
2. Bullish Sentiment Phase:
When both on-chain data and sentiment indicators show sign of bullish sentiment consider entering long position
Entry Criteria:
- Price Action: Look for higher highs and higher lows in the price chart.
- Volume Confirmation: The price move should be accompanied by rising volume.
- Sentiment Confirmation: Positive social media mentions and an upward trend in sentiment analysis tools.
- Breakouts: A breakout above key resistance levels or recent high can serve as an entry signal.
- On Chain Support: Monitor Steem on chain data for increases in wallet activity or token staking.
Exit Criteria:
- Over bought Conditions: Monitor technical indicator likes the RSI (Relative Strength Index). If RSI reache over bought levels (above 70) it may be time to exit or take profit.
- Price Action Reversal: A bearish reversal patern (e.g. shooting star bearish engulfing) after strong bullish trends.
- Divergence: If the price is rising but sentiments indicators or on chain data show weakening bulish sentiment consider exiting the positions.
Risk Management:
- Stop Loss: Set a stop loss below recent support level or fix percentage los (e.g. 3% or 5%) from the entry price.
- Position sizing: Use a fixed percentage of your Portfolio (e.g. 2-5%) for each trade to manage risk.
- Trailing Stop: Use a trailing stop to lock in profits if the Price continue rising.
3. Bearish Sentiment Phase:
When the market shows signs of bearish sentiment you can either exit long positions or enter short position (if applicable on the platform you are trading).
Entry Criteria:
- Price Action: Lower lows and lower highs in the price chart.
- Volume Confirmation: A decline in price should be confirmed with increasing volume.
- Sentiment Confirmation: Negative sentiment on social media and from sentiment analysis tools.
- Breakdown: A breakdown below support levels or recent lows can signal bearish phase.
- On-Chain Data: Decreased wallet activity lower staking or less overall Steem usage.
Exit Criteria:
- Oversold Conditions: When the RSI moves below 30 it suggests that Steem might be oversold and could rebound.
- Price Action Reversal: A bullish reversal pattern (e.g. bullish engulfing or hammer) after a strong downtrend.
- Divergence: If the price is falling but sentiment indicators show uptick or signs of positive news consider exiting the position.
Risk Management:
- Stop Loss: Place a stop loss above recent resistance or key levels in the price action to limit loss
- Position Sizing: Similar to bullish positions risk a fixed percentage of your portfolio.
- Trailing Stop: For short positions use a trailing stop to protect profits as the price falls.
4. Example of Application:
Lets take recent data as an example:
- On 11/30/2024 Steem's price was $0.26496 down by -0.87%.
- On 11/29/2024 it had increased by 3.36% from the previous day indicating bullish short term phase.
If sentiment analysis tools or social media mention suggest positive sentiment for Steem (e.g. news of platform improvements or partnerships) you might consider entering a long position after confirmation from the price action (e.g. a breakout above $0.27 higher than the 11/29 price).
If Steem price shows a continuation pattern like an uptrend you could exit near overbought conditions such when the price has gained 10-20% from your entry or when technical indicators show a reversal.
For a bearish phase if the price falls below $0.25 (e.g. a breakdown of support) combine with negative sentiment from on chain data and social media it may be a signal to enter a short position or to exit your long positions.
| This sentiment based strategy require a careful combination of price action sentiment analysis and risk management. Its essential to adapt the strategy based on changes in sentiment and market dynamics. The goal is to enter trade that align with the prevailing market sentiment while managing risk effectively using stop-loss orders position sizing and profit-taking techniques. |
|---|
Question 5: Limitations and Best Practices in Sentiment Analysis |
|---|
Sentiment analysis in the market is powerful tool for traders but it has several challenges and limitations that can affect its effectivenes. These challenges can lead to misleading signals which can result in poor trading decision. In this answer I’ll share some of these challenges and offer tips on how to improve the reliability of sentiment based trading strategie.
Challenges in Sentiment Analysis:
- Delayed Reactions:
One of the biggest challenges with sentiment analysis is that market reactions based on sentiment can often be delayed. For example if there a negative new report about a cryptocurrency the market might not immediately reflect the negative sentiments. It might take a few hours or even days for the price to drop as traders react to the news at different times. This delay can create situation where you miss the optimal trading window because sentiment based signal don’t always trigger immediate price change.
Example: Imagine that a major exchange gets hacked and news spreads quickly on social media. Sentiment analysis might pick up on the growing negative sentiment in real-time but the price might not drop until a few hour later after other trader have had time to process the news. If you’re waiting for a market reaction that doesn’t come immediately you could miss out on the best oportunity to trade.
Misleading Signals:
Sentiment analysis often relies on the language used in social media posts news articles and forums. However not all online discussion reflect the true market sentiment. Sentiment analysis tools may misinterpret sarcasm joke or overly optimistic comment which can lead to inaccurate signals.Example: If a popular figure in the crypto community tweet something like "The market is going to crash soon just you wait " some sentiment tools might interpret this as sign of negative sentiment. However if the tweet was sarcastic or part of larger conversation where the author was actually optimistic this could lead to a misleading signal.
Noise in Data:
The data from social media platforms like Twitter or Reddit is often noisy meaning it contains a lot of irrelevants information that doesn’t contribute to the market sentiment. For example spam messages memes or unrelated discussion can clutter sentiment analysis results leading to confusion. Sorting through this noise to find the true signals can be challenging.
Example: On Twitter there might be thousands of tweets using the keyword "Bitcoin" in a day. Many of these tweets might not be about the actual market movement but could be about discussions like Bitcoin role in pop culture or even Bitcoin themed memes. This noise can distract from the genuine market sentiments.
Best Practices to Improve Sentiment Analysis:
- Use Multiple Sources of Data:
To improve the accuracy of sentiment analysis its important to use multiple sources of data. Don’t just rely on one platform like Twitter; combine sentiment data from news articles crypto forums blogs and social media. This helps to get a more balanced view of the market and reduces the risk of misleading signal.
Example: Instead of only looking at Reddit post also check out news headlines community discussions and Telegram group sentiment to understand the full picture of how people feel about a certain cryptocurrency.
- Incorporate Technical Indicators:
Sentiment analysis work best when its combined with traditional technicals analysis. By incorporating indicators like moving average Relative Strength Index (RSI) or suport and resistance levels you can filter out the noise and use Sentiment analysis as confirmation tools rather than the sole basis for a trade.
Example: If sentiment analysis shows a bullish sentiment for a coin but the technical indicator are showing overbought condition (like an RSI above 70) it might be a sign to wait before entering a trade. These technical indicator can provide reality check ensuring you don’t act solely on sentiment.
Focus on Long Term Sentiment:
Short term market reactions can be volatile and deceptive so its often better to focus on long term sentiment trends. This allow you to make decisions base on a more stable and consistent sentiment rather than reacting to every smalls fluctuation.Example: If there a sudden surge in positive sentiment over cryptocurrency due to a news event it might be tempting to act quickly. However its important to assess whether the sentiment shift is part of a longer term trend or just a temporary reaction. Long term trends can provide more reliable signal than short term spike.
Backtest Your Strategy:
Just like with any trading strategy its important to backtest sentiment analysis to see how well it performs under different market conditions. By analyzing historical sentiment data alongside price action you can refine your strategy and determine how best to use sentiment analysis in various market environment.
Example: You could backtest sentiment analysis during a bull market bear market and sideway market to see how it would have impacted your trades. If sentiment analysis perform well in one type of market but not in others you can adjust your strategy accordingly.
Avoid Over Reliance on Sentiment:
While sentiment analysis is valuable tool it shoulds never be the sole factor driving your trading decision. Its crucial to combine sentiment with other aspect of market analysis such as fundamentals and technicals to make more inform decision.Example: Imagine that sentiment analysis shows a positive shift in favor of cryptocurrency due to a new partnership announcement. While this could be good reason to be optimistic its important to also check if the fundamentals of the coin are strong or if the partnership is significant enough to have a real impact on it value.
| Sentiment analysis is a valuable tool in market trading but it comes with its challenges including delay reactions misleading signals and noisy data. By using multiple data sources combining sentiment with technical analysis focusing on long-term trend and backtesting your strategy you can improve the reliability of your sentiment-based trading decisions. Remember that sentiments should be one tool in your tool box not the only factor you rely on when making trading decisions. |
|---|
.png)
.png)
.png)
.png)
.png)
.png)
.png)
.png)
.png)
.png)
.png)
.png)
.png)
.png)
.png)
.png)


Hi, @hamzayousafzai,
Your post has been manually curated!