Support and resistance breakouts - Crypto Academy / S6W3 - Homework post for pelon53
Greetings, my friends:
Now we are in Season 6 of week 3 in Steemit crypto academy. making a homework post is a great difficulty for me because it requires hard work and research on the topic. I am grateful to all my Steemit teachers that provide a good piece of knowledge to all of us. so, let's move towards the topic:
1. Explain in detail the advantages of locating support and resistance on a chart before trading.

before taking any trade a good trader must analyze the market and also the chart patterns. in the chart pattern, a trader examines the technical analysis with the help of support and resistance levels. support and resistance is the area in which the price of a commodity goes higher highs and lower lows. at higher highs price levels it marks their Resistance and at the lower low price, it marks their support both of these terminologies are very handy to examine the chart.
To identify the Support and the resistance levels the first step which you take is doing the technical analysis and with the help of analysis, you will reach any decision whether you will buy or sell any trade or not.
so, here we discuss some advantages of locating support and resistance:
Examine the Market cycle:
By locating the support and resistance levels you will mark the price area. in this price area, you will see the price fluctuations with help of this we will be marked whether the price area is at maximum or minimum of buying and selling any commodity within a certain time period.
Trend Identification:
To locate the Support and resistance levels we need to trend identifications.
Support and Resistance breakouts show the trend and trend reversals.
if the price rises above the resistance levels it indicates the uptrend levels.
if the price is below the support level, it indicates the Bearish trend.
Sideways Market:
As we all know sometimes the market is sideways means there are no clear signals of uptrend and downtrend. so, therefore we can easily determine the market with the help of locating support and resistance levels. and easily check out the market flow.
Ease of Indicator Management:
Locating the support and resistance levels is not rocket science it is very easy. it is a baby step to learn any type of technical analysis. support and resistance lines are very easy to draw on the chart and you can easily configure it in a handy way. you can also make your investment and hold it for the long, short term, etc.
2. Explain in your own words the breakout of support and resistance, show screenshots for the breakout of resistance, use another indicator as a filter.
Breakout levels of support and resistance are very important. after the breakout did the market sometimes move towards the bullish and sometimes towards the bearish. both of these trends are observed after the breakout. so, let's understand the Breakout of support and Resistance one by one:
Breakout of Support:
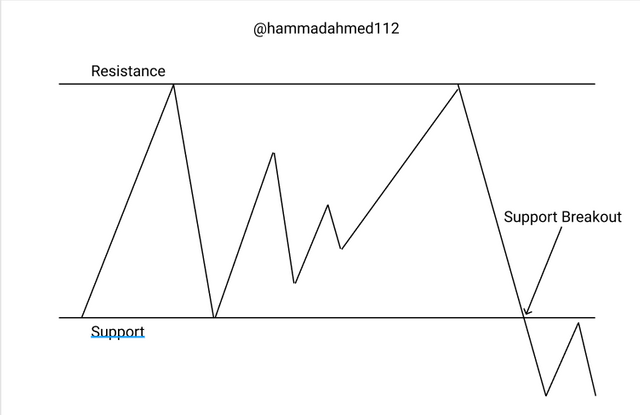
The Support is the low level in the chart with the help of support we can determine the good or low price of buying any commodity and assets. an investor looks and waits for the Breakout of support because it gives the advantage to buy any assets at a low price.
Support Breakout is not a big thing it is the lowest level after the support and at this level, the price goes down more and more. which shows a huge amount of money inflow in the market.
Breakout of Resistance:
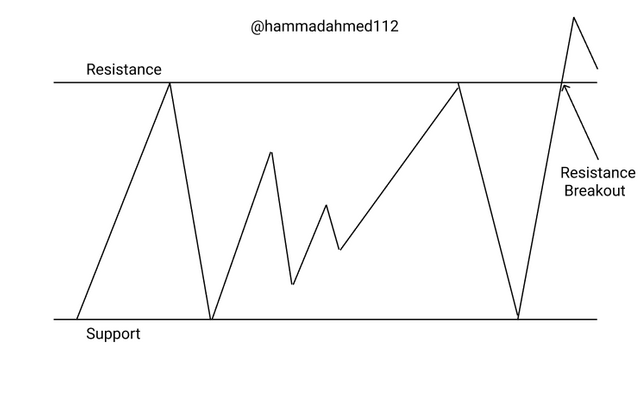
The Resistance is the high level in the chart with the help of resistance we can determine the good or highest price of selling any commodity and assets. an investor looks and waits for the Breakout of resistance because it gives the advantage to sell any assets at a high price.
Resistance Breakout is not a big thing it is the highest level after the resistance and at this level the price goes down more and more. which shows a huge amount of money outflow to the market.
Resistance Breakout with Indicator:
The breakthrough of support and resistance levels, as we've seen, provides objective information regarding the start of a bullish or bearish trend.
The important thing of resistance breakout is the uptrend and we require the uptrend for the breakout. for the breakout, the price will be more than the level of resistance that we marked and to confirm with another indicator which is useful.
I will select the Parabolic SAR for more accuracy of breakout it gives the required result with less error of chances. see in the chart below:
From the above image, I select the token ADA/USDT one-hour time frame. I have marked the support and resistance levels. after marking I have selected the SR parabolic indicator. which help us and give the signals.
In the above answer, I discussed some break-out levels for bullish and bearish and it is possible and when for low return in a small time and when this situation occurs the price and immediately rise again and here this level become the support.
SAR is a trend-following indicator that provides the trader with three important signs for commencing a technical analysis with support and resistance:
i. the very first is when the dotted line is drawn the chart we are in the downward.
ii. the second is when the dotted line above the chart we are in downward.
iii. the third and the last is when the dotted line is above or below so, it means there is a change in a trend.
3. Show and explain support breakout, use the additional indicator as a filter, show screenshots.
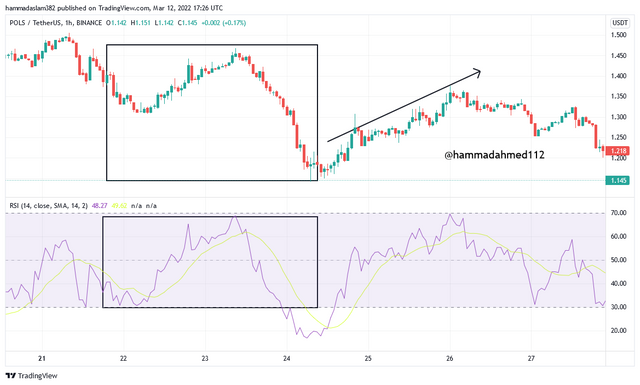
When support levels are hit, the price heads to resistance, and you may easily place your sell order with more analysis. This is essentially what a support break-out indicates.
Price was in consolidation before shooting up, generating a succession of higher-highs and higher-lows, indicating an uptrend continuation, as shown in the chart above. I used the
RSI=relative strength index to analyze my chart.
The RSI indicator is one of the most often used by technical analysts to evaluate the market's phase throughout trading sessions. It analyses the overbought and oversold both in a trending market.
The RSI Indicator measures 70 for overbought regions in the market and 30 for oversold regions, which implies you can buy when the RSI measures 30 for oversold and 70 for overbought.
4. Explain what a false breakout is and how to avoid trading at that time. Show screenshots.
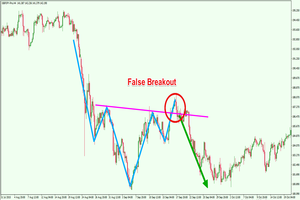
False break-out occurs when price moves from either the Support or Resistance levels but lacks the strength to keep the strength in balance, i.e. maintain the move.
As a trader, I normally enter a position when there is a breakout, whether it is from a support or resistance level; however, in order for me to avoid losing money, the breakout must be re-tested up to two times before I consider the trend to be real.
You don't just notice a one-time Breakout and place a trade without knowing whether or not this is real; the break-out could be a false one, and traders may be compelled to complete its trade-in the wrong way. in a case, if they are not careful.
source
from the above chart, you have seen the supports levels were correct, as the price tried to break through the Support level both in the first and second high the price goes to bearish rather than bullish.
At this point, the trend has failed because the price has moved past the Support phase rather than the Resistance level. keep in mind the difference exists between a break-out and a throwback; a throwback is just a little different.
5. On a demo account, execute a trade when there is a resistance breakout, do your analysis. Screenshots are required.

When trading a break-out, it's important to be cautious. You can use an indicator to validate the break-out, and other tools can be added for more successful trading decisions.
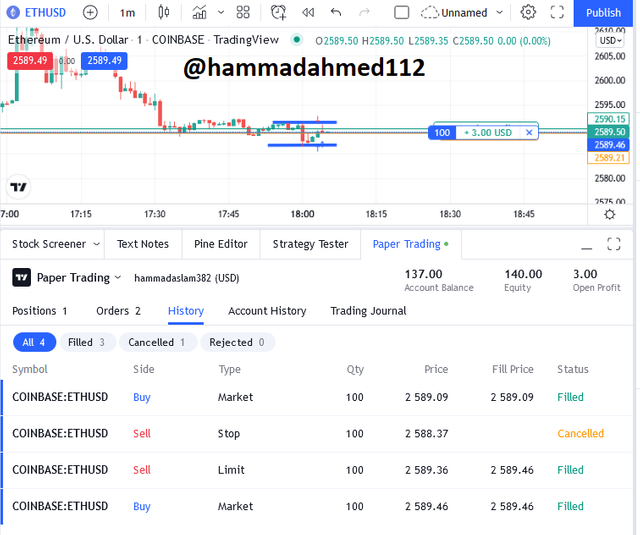
As I previously mentioned about the resistance breakout. it occurs when the price continuously goes upward. Investors start buying because of the high price of assets. the chart I draw is the ETH/USDT pair. I do paper trading on it. see in the snapshot:
see the above chart which is ETH/USDT, the important term is to check for the price towards the resistance it breaks is Market structure. I see the double bottom formation on the chart above, which indicates that the market is about to turn bullish.
6. In a demo account, execute a trade when there is a support break, do your analysis. Screenshots are required.

Technical analysis is the study of charts, which contain diverse patterns and formations all over. The ability to recognize strategic formations is important since the market moves in a zig-zag pattern.
When a breakout occurs, most traders take advantage of it; however, other traders use the breakout as a technique, locating patterns and using them all around.
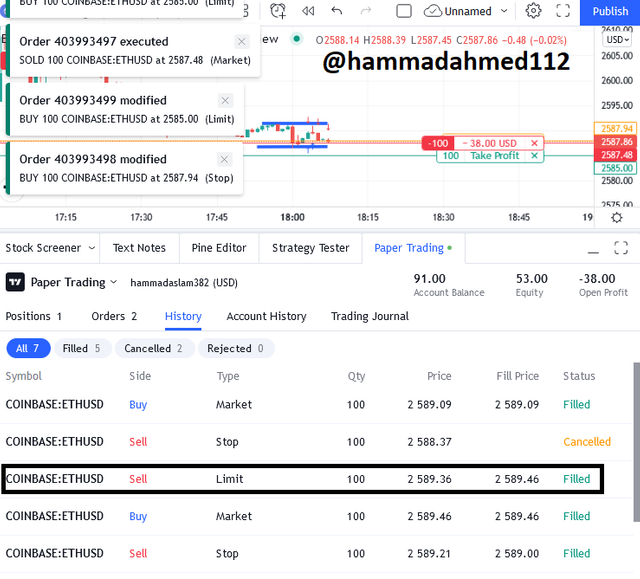
When support breaks, the market sells; several traders around the world wait for this setup in this terms because there are various factors that can be put in place to make sure that this setup is true.
The indicator should be used as the sole yardstick for determining the market's phase; here, I took into account price actions and likely retracement zones; trust me, your profit potential will be full of fun and greed.
Conclusion:
Support and resistance levels are the most fundamental indicators in technical analysis, therefore they can't be overlooked; in fact, they should be the first things to consider when beginning a market analysis.
Because the goal of discovering these market price interaction zones is that they are the strongest that can be tracked, the price at higher section the operation's success will be heavily reliant on their precise identification.
In the end I am thankful to prof @pelon who gives us the knowledge of support and resistance breakouts.
so, that's it for today's lecture I hope you liked it.
Thankyou!
Regards,
