Crypto Academy / Season 3 / Week 3 - Homework Post for @lenonmc21 || Trends, Trend Lines and Chart Patterns
Thank you @lenonmc21, for your amazing lecture this week. It is great to learn about trends, trend lines, chart patterns and how to draw trends lines in your class.
I will be submitting my homework through this medium. To answer all questions completely, I will like to arrange in in an outline first before attempting them one after the other. I hope my work will meet your requirements.

A trend is the perceived tendency for prices to move in a particular direction. In cryptocurrency, this can be divided to bullish trends and bearish trends. A bullish trend is when the price of the asset is moving upwards. In this case there is a significant buying action, thus the price moves up in a significant way over a period of time.
The bearish trend is the direct opposite, in that the price of the asset moves downwards over time. It shows the selling action of traders or holders of the asset.
In order to recognize a trend, there must be a time frame for which the trend is said to occur. Having said this, trends can seen through a day’s market chart, week or even a month. Few minutes are too short to recognize a trend.
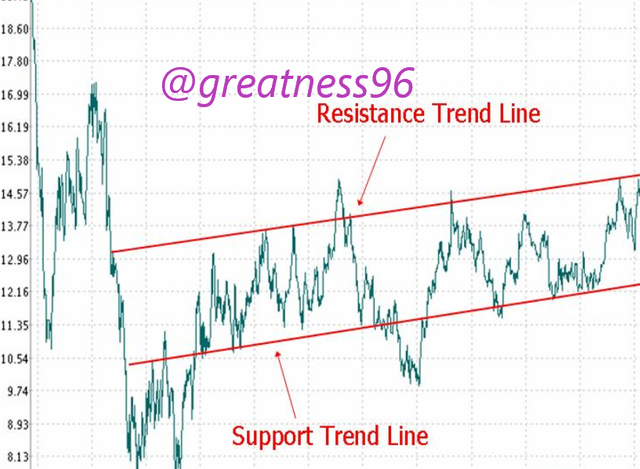
On a price chart of an asset, example BTC, it is important to have a clearer view of the direction of the price. In order to do this, a trend line is drawn on the price chart.
Thus, the line drawn on top of a pivot high or under a pivot low of a price chart for the purpose of showing the prevailing price direction is called a Trend Line.
I hope this is explanatory enough.
Roles of Trend in Charts
In an asset price chart, identifying the trend is the first and fundamental thing to do before starting a trade or investment, if you must make a successful trade. The trend shows the direction of the market, either bullish or bearish. Traders get to know when to buy or what to buy through reading the trend in the course of their technical analysis.
If the trend is upward (bullish), it shows the asset is being bought by a lot of traders and investors. This shows a positive psychology of market engagement.
The opposite is the case in the case of a downward (bearish) trend.
Thus, in a chart the trend is the first indicator of price action for the particular asset over a period of time.
Roles of Trend Lines in a Chart
While trends are time based, trend lines can be used to determine price action on a chart irrespective of the time frame. Trend lines are used to ascertain market trends, thus making clearer to understand the price action and possibly forecast the next market moves.
The trend line can simply be drawn to show the price action in open, high and low as the asset price progresses. Through this record, it could be predicted how high or low the asset price could go, given the effectiveness of the trend lines on the chart.
To draw an uptrend line, you need two or more points on the support in your chart. Once these points are identified, you can draw a straight line to join the points.
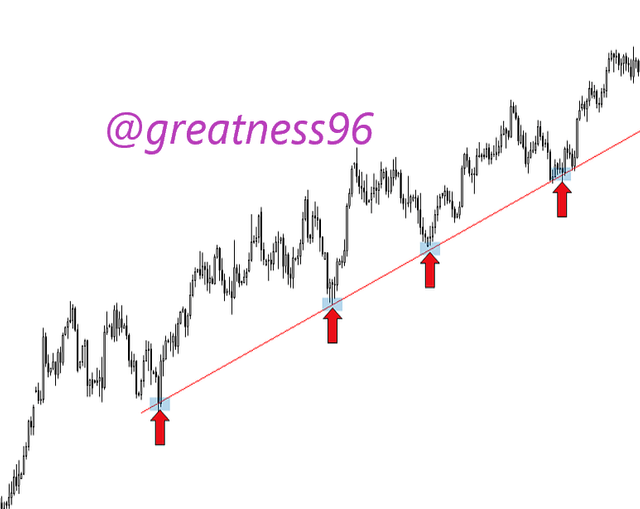
From the above chart, you can see the straight line touching each point of the support. That is how to draw an uptrend line.
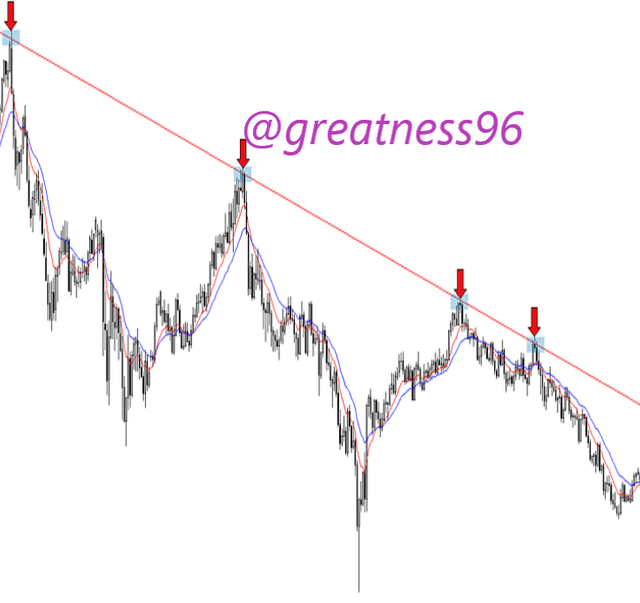
To draw a downtrend, you need to identify the points on downtrend. This is basically drawing a straight line to touch the points on resistances. The line drawn here represents the downtrend.
In technical analysis, support and resistance forms the basics of the analysis for traders. It is practically impossible to analyze a trade without considering these two factors.
What is support?
In a price chart, a support is a price level where downtrend is expected to be put on hold as a result of an increase in buying interest or demand for the asset in the market. When the price of an asset, like Bitcoin falls, investors tend to develop interest in buying. This buying interest causes a reverse from downtrend to uptrend. The point of this reversal, like a sharp elbow, is called support.
What is a Resistance?
Resistance on a price chart refers to a point of reversal in price from uptrend to downtrend as a result of a selling interest when price of the asset goes high.
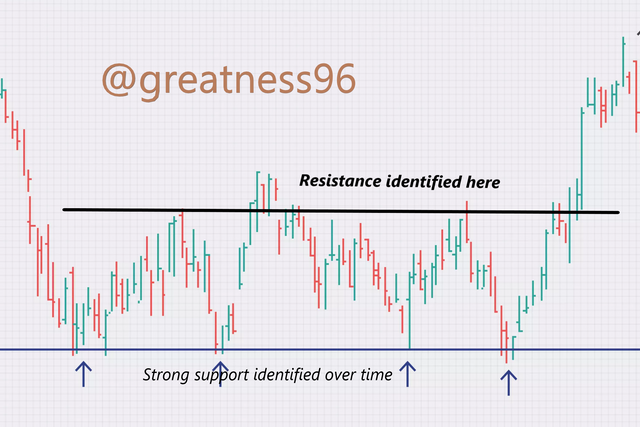
Traders use the support and resistance zones to ascertain when to enter or exit a trade. It is believed that when this zones are spotted, there is a potential for a bounce back or continuous formation of support and resistance along the chart.
This can be done by drawing a horizontal line that cuts across significant resistance and support. After drawing the line, extend it to the past price actions to ascertain if past price actions behaved in the same way.
If the line touches more of same level of support or resistance, it shows that more of that will be formed in the future.
Therefore, a strong support or resistance is determined by how many times these levels touch the horizontal line from the past to present.
The two chart patterns I want to discuss here are the double top and the double down.
In crypto market, the price of an asset always experiences a resistance before retracing back to form a support. The double top pattern is used to identify price reversals.
After the peak or all time high (ATH), the price reverses back to follow a normal trend.
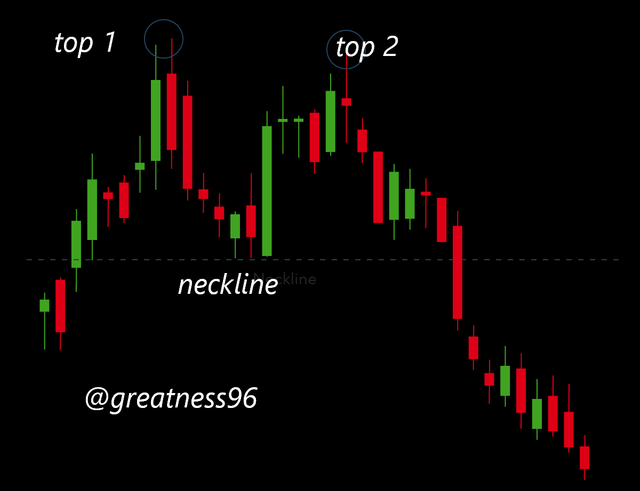
This is seen when an asset price falls below the support level. This happens during a selling pressure. The price is seen to rise to a resistance level before dropping again.
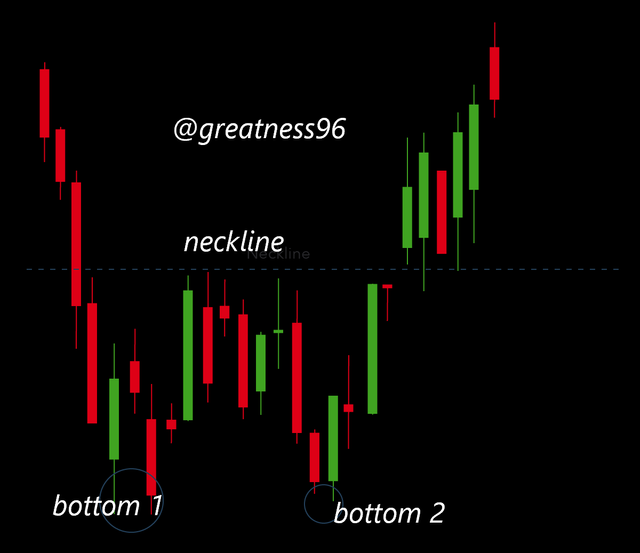
A double bottom shows a bullish reversal pattern and signifies the end of a bearish market as the price shifts to a bullish trend.
In technical analysis, trends, trend lines and chart patterns are very basic. No trader can successfully pull out an analysis without these tools.
It is important that as beginners, we should understand these basics and make use of it for our advantage.
Thank you for reading.
Hi dear kindly put a source reference to your images because you be caught by end plagiarism. Hope you know how to do it if you don’t know I can help you . This is what you do open brackets type the word source then close brackets then also open another bracket and paste in the link where the picture was got from then close brackets thank you [source](google link)
Thank you for your concern. The image sources could be found on the 5 references given.
Thanks.
Ohhhh okay you are welcome I didn’t know that and I have also learnt it from you