BTC, Steem, SBD chart review February 9 2018

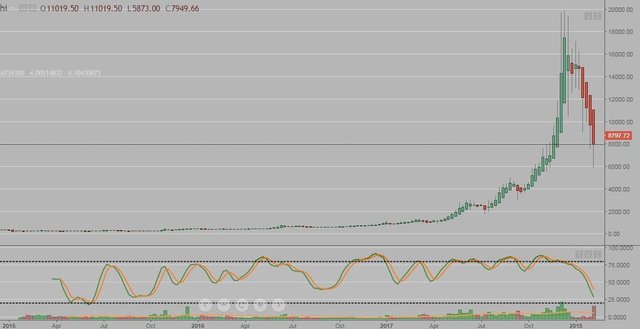
Hello all, here are my observations this evening for the charts of BTC. Looking at weekly chart we obviously see the massive rise and fall. The stochastics (green/orange lines below the chart) have not been at the current low level since 2015 (Close to 3 years)
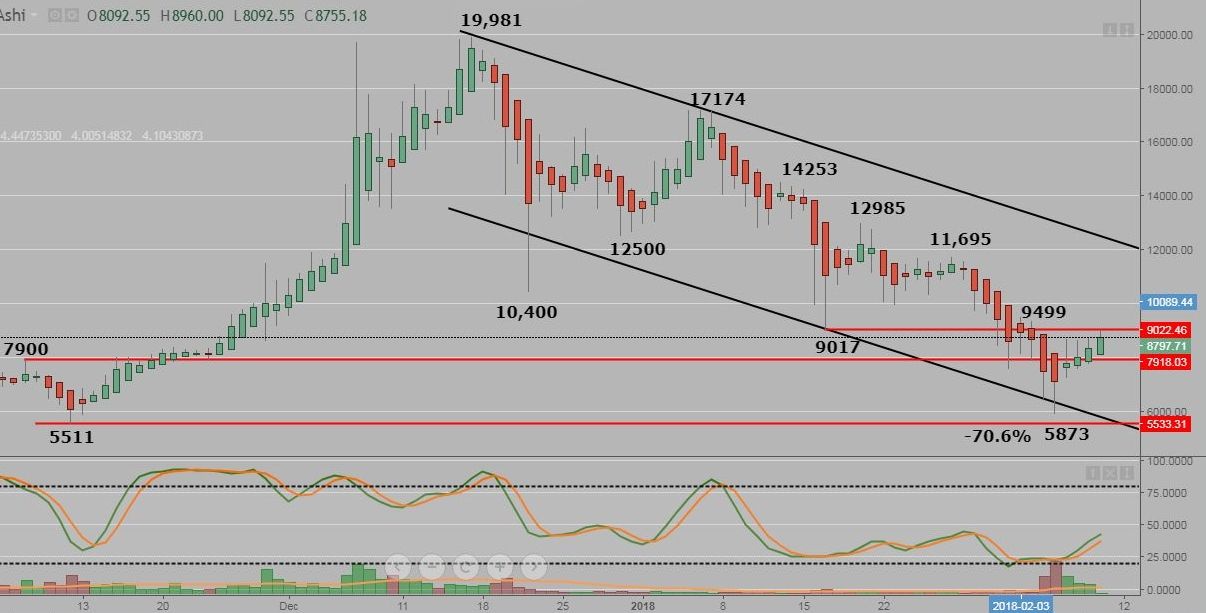
The daily chart from the GDAX exchange with a Heikin Ashi overlay on the candlesticks.
It has printed 4 green daily bars which is a bullish sign since bouncing off of the lower trend line.
BTC needs to continue trending up and over the 9499 level to start producing higher highs from the bottom.
Although the last low had the highest amount of volume within the downtrend (Which may have indicated the bottom), it is still trading within the bearish channel. If BTC does continue the uptrend, it will eventually break out and above the upper trend line.
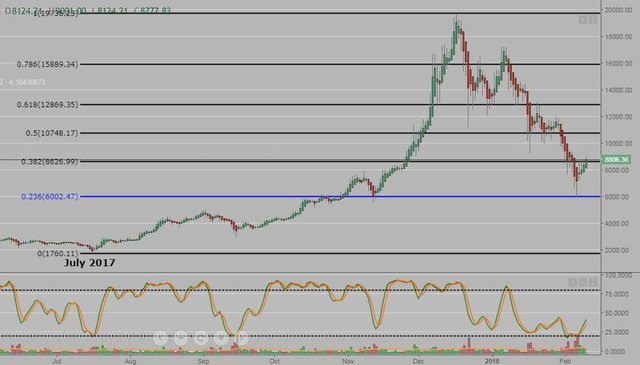
This chart is from the Bitfinex exchange and has a fibonacci from the July 17 low to the peak in December 17. The pullback spiked down to the .236 fib level (Blue line) which may have also confirmed a potential bottom. So in a long term trend, it technically did not produce a lower low within this timeframe. (A good sign if you are bullish)
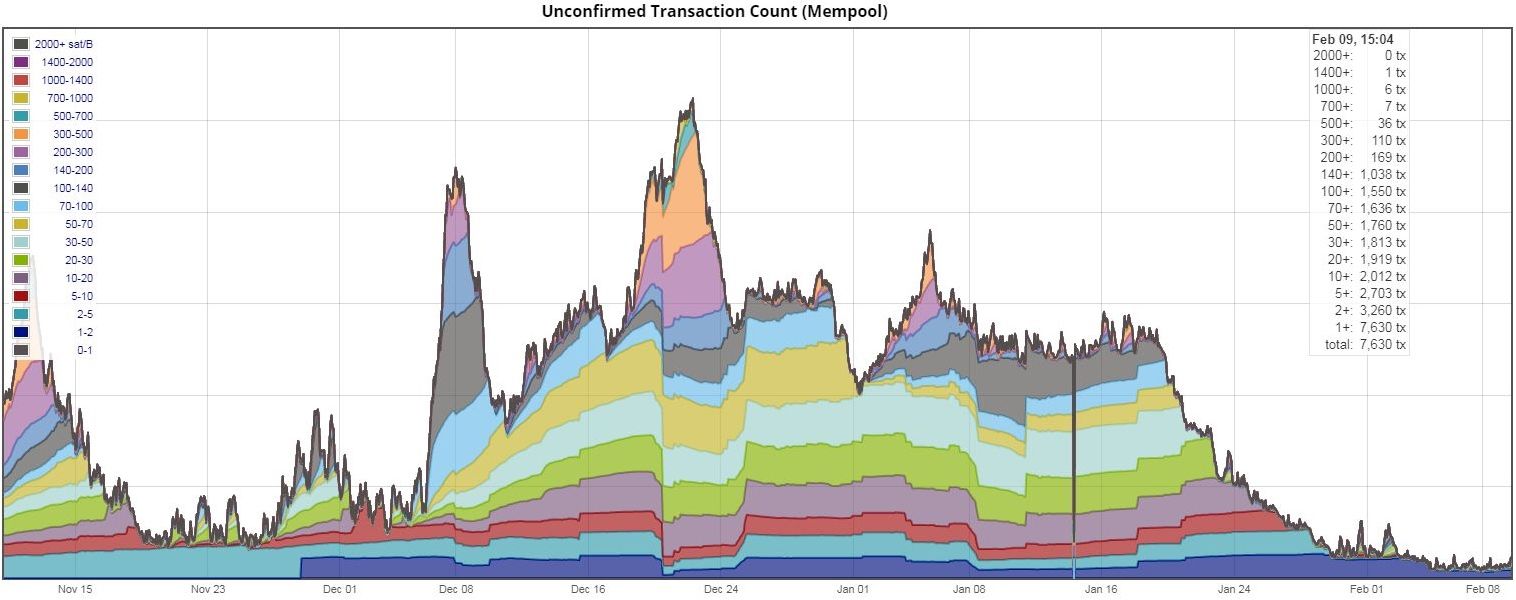
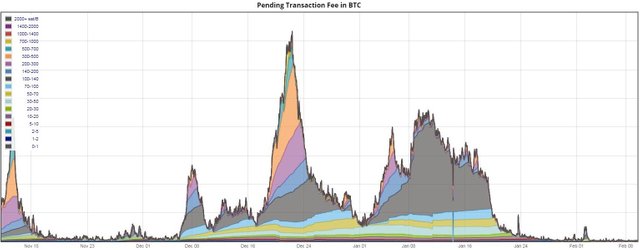
Here is a 3 month look at the mempool (Unconfirmed BTC transactions) Don't have to wait long to get confirmations these days...
The average BTC transaction fee over the last 3 months. The average fee is currently $4.13, December 22nd it was $55.
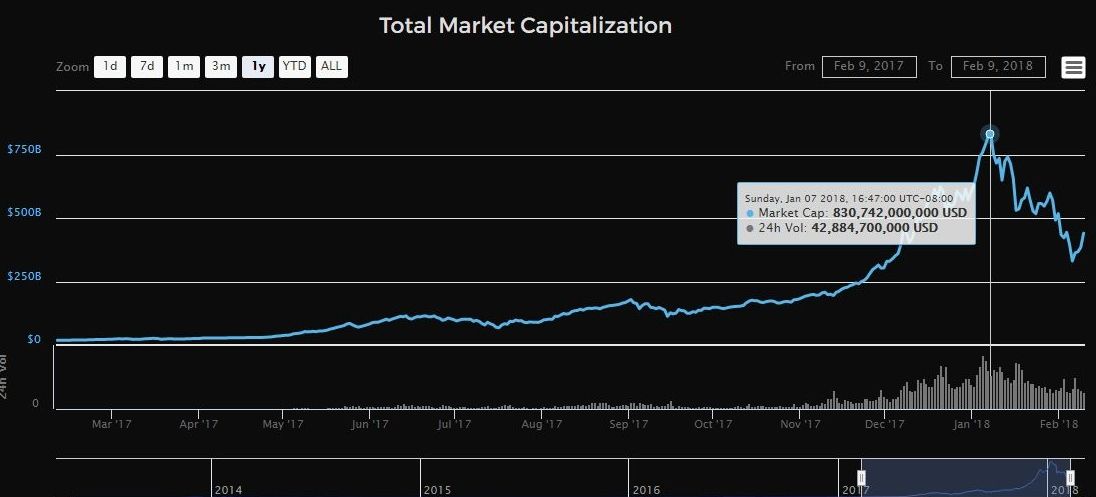
The total crypto marketcap at it's peak was 830 billion, at the low a few days ago it was 282 billion.
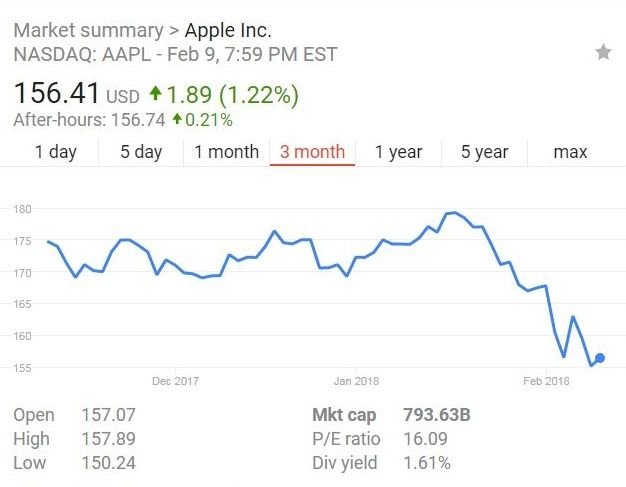
By comparison to a 'conventional' company on the stock market, Apple's marketcap is currently at 793 billion.
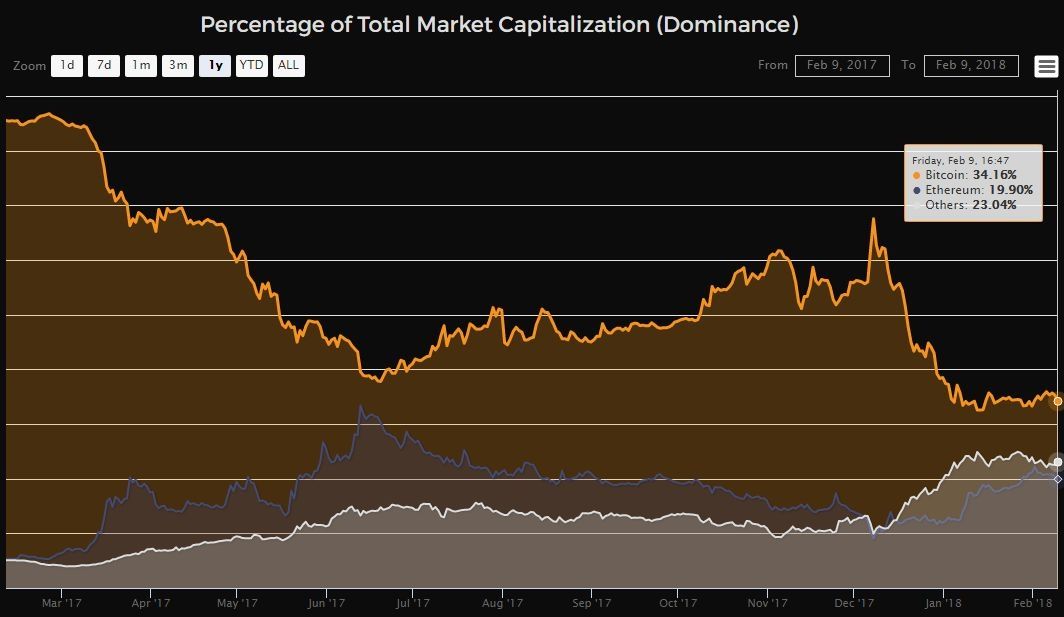
BTC marketcap domanance is near the lows at 34% (Compared to 85% a year ago), ETH at 19.9%, Alt coins at 23%
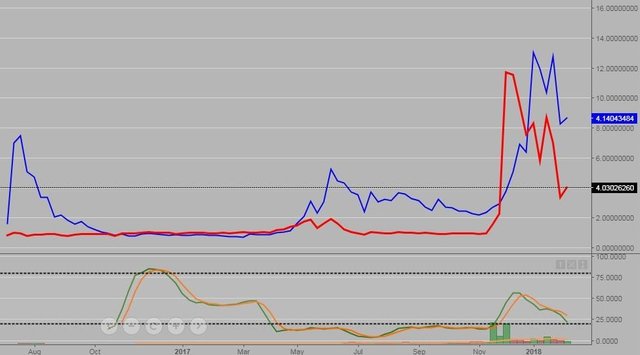
Here is a weekly line chart of Steem in blue and SBD's in red, quite a ride since the beginning...
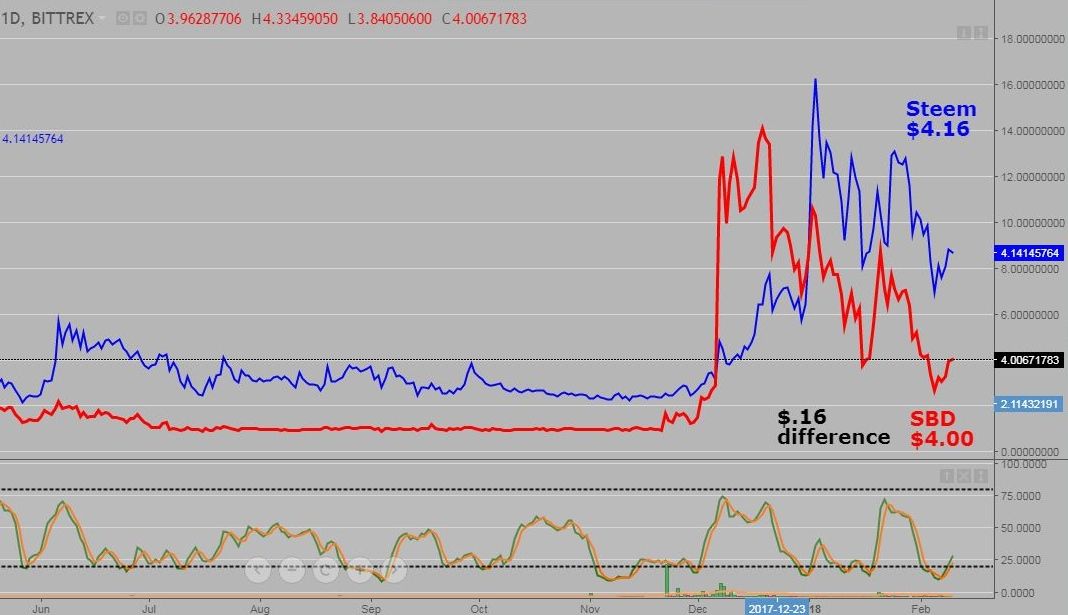
When you compare the 2 on the daily chart, you can see that SBD shot up and past the Steem price late last year then started to decline. Steem rallied past SBD and is currently around .16 higher.
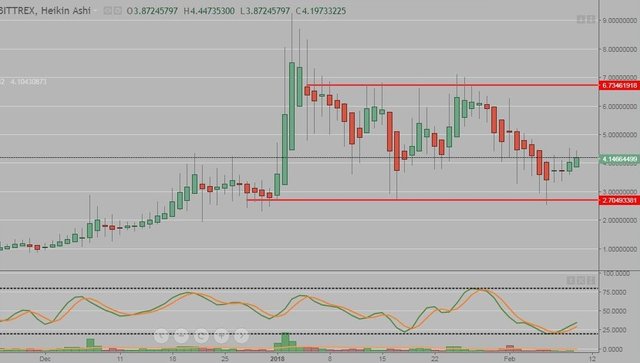
The Steem daily chart with a Heikin Ashi overlay on the candlesticks. Steem was in a trading range last year for months and may be in the same pattern, only higher.
Coins mentioned in post:
For more Analysis to @a-blockchain
This post has received gratitude of 3.23 % from @appreciator thanks to: @glennolua.
You got a 3.92% upvote from @postpromoter courtesy of @glennolua!
Want to promote your posts too? Check out the Steem Bot Tracker website for more info. If you would like to support the development of @postpromoter and the bot tracker please vote for @yabapmatt for witness!
You got a 2.79% upvote from @buildawhale courtesy of @glennolua!
If you believe this post is spam or abuse, please report it to our Discord #abuse channel.
If you want to support our Curation Digest or our Spam & Abuse prevention efforts, please vote @themarkymark as witness.
nice analysis.....good explaination....