Crypto Academy Season 3 | Intermediate Course: Crypto Assets and the Random Index (KDJ) by @gema777

Source
I hope you are all very well today we will talk about the indicators KDJ, ADX, ATR but we will focus more on the ADJ as it allows us to have a very solid appreciation of the trends in the short and medium term that is to say that we will have the opportunity to enter markets to analyze technically and to enter and exit at strategic points thus increasing the possibility of our gradually increase.

In your own words, define the random index and explain how it is calculated
The KDJ indicator which is known as random index is the most common indicator among traders that combined with other indicators is a very powerful tool if you know how to use it. It is used to make technical analysis and in this way to speculate the market in the future we can also see this indicator has 3 percentage lines the k, D and J each of these lines has a different color for the K blue color, for the D Red, and the J Black if we know the indicator is very effective in short or medium temporalities because if we see it in the long term it can generate incorrect signals therefore it is more advisable for these periods of time,
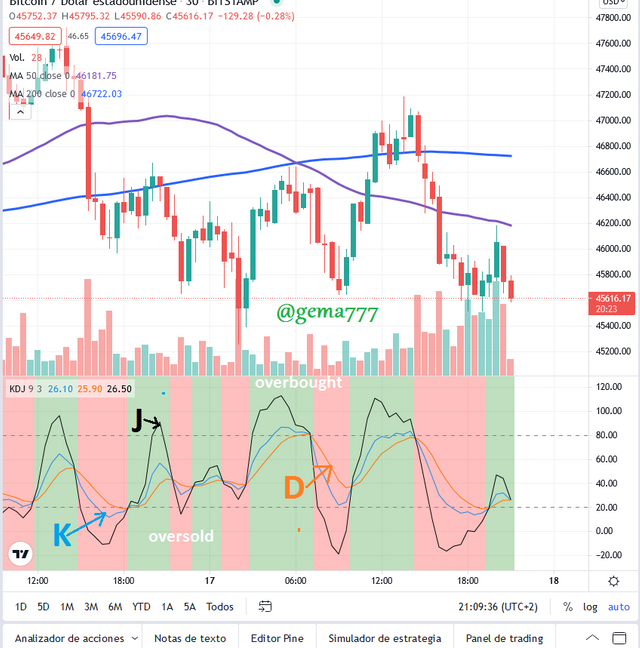
To identify each line we can say that the black J line indicates the divergence in the business when the J line is below 20 indicates that there is an oversold but when it is above or in the 80 indicates that there is an overbought in flat markets is more difficult to obtain immediate clear answers.
The three lines are calculated as follows:
PcA = closing price of assets.
PmA= minimum asset price.
Pt=Period of time
Pa=High price
Pm= Price min
Equation= PcA-PmA/Pt-Pm= k
Line J = 3-period SMA K
J= 3%K-2%D
The random index or KDJ has a range in the table from 0-100 the 0 is the lowest price and 100 is the highest price range. all this within an estimated time range, it is used to know when the stochastic oscillator indicator is overbought or oversold when it is oversold is below 20 points and when it is oversold is higher than 80 points. at this point we will determine entry and exit points with stop loss of the market.
Is the random index reliable?
When reliable in general terms we know that the indicators do not give us a 100% accurate result for this we have to perform a very deep analysis with several indicators and from here we make a decision depending on the market trend the strength and psychology of the current market for this we perform sentimental analysis and really determine where the trend goes together with the random index we can identify patterns that are repeated over and over again in the course of time we can see with KDJ where to enter and exit with the J and KD lines .
We know that it has the ability to mark the entry and exit point very efficiently, we also know that there are false signals that KDJ can indicate to us because we are talking about short time ranges, therefore it is recommended to put it together with other indicators and thus have a clear view of the time range and trends in the future to make decisions according to the results and accept in the largest of cases then implement a strategy that we are feasible to operate in a productive manner.
How to add the random index to a chart and what are the recommended parameters
To access this web site we must enter the official page Source](https://es.tradingview.com/
Start section and we begin.
Source
Then we must start in "chart" to be able to access the graph where we are going to start the process.

Source
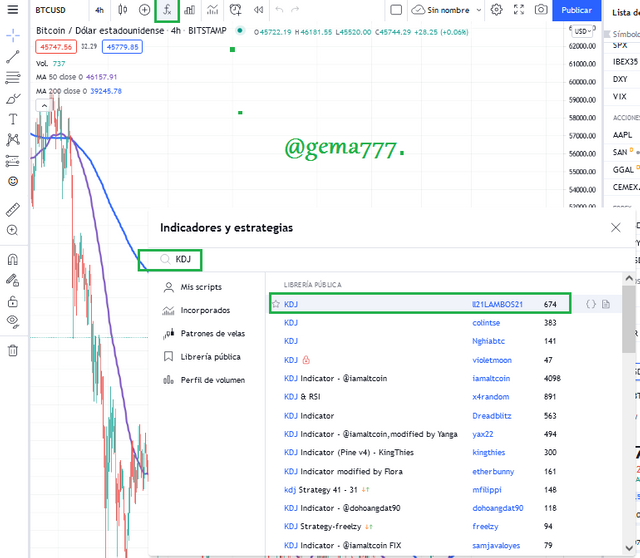
step 1: we go to the upper left side and we see a symbol that says "indicator and strategies" click on it
step 2: Then we see a window with the search option we must put "KDJ".
step 3: We select the first of ll21LAMBOS21. and ready we have our indicator activated.
Source
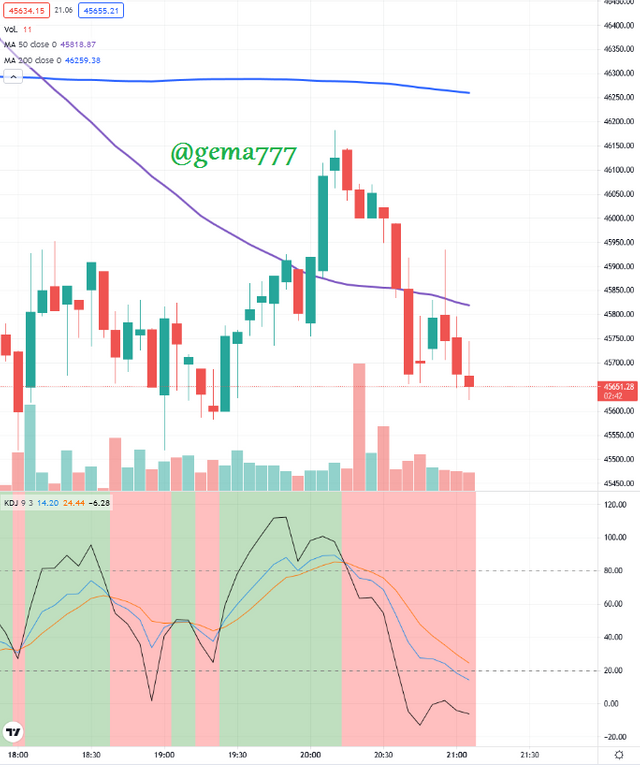
We see here in the 5min time frame how the three lines of the KDJ indicators establish a zig zag like waves in the sea and this is where they indicate the trends in the previously mentioned ranges.
Source
Visualization of KDJ lines, oversold, and overbought.
Source
Differences between KDJ, ADX and ATR
As we well know each of these indicators has something in common and they differ from each other by their main characteristics below I will explain each of these and why they differ from each other. but together they are a strong set for technical analysis.
KDJ:
Random index is an indicator that allows us to speculate on the market in short and medium range of time, it has 3 lines that surf the graph in a way to the trend and parameters of the market in question, the KDJ lines signal us the different high and low trends of the market by a limited parameter of 0-100 if it is in 20 or below 20 signals us an oversold and immediate buying position, if it signals us greater than 80 or in 80 indicates us overbought and clear position of sale.The ADX
unlike the KDJ that are 3 lines the ADX is a single line that marks the strength of the trend in question, ie the amount of force that brings an asset in a certain range of time, this helps us to identify a false trend as its strength and its duration time of a true trend and longer duration as its total strength. the ADX has parameters that identify the values of strength which areADX = 75-100 STRONG AND INTENSE TREND
ADX= 0-25 SERIOUSLY WEAK STRENGTH
ADX= 25-50 STRONG TREND
ADX= 50-75 STRONG AND VERY STRONG TREND.
ATR=AVERAGE TRUE RANGE
, It is used mostly for assets and stocks, marking the volatility of the asset in question, when we see that an asset has a high value in ATR this means that it is in high volatility but if we see the opposite a low ATR indicates a low volatility in the asset we are studying this indicator has much difference from ADX and KDJ as it has nothing to do with their functions but together they are a very powerful analytical tool.
Source
Use random index signals to buy and sell two cryptocurrencies.
I start section and choose on the ETH/USDT chart.
Then using the "Paper Trading" option.
I will perform the trade immediately.
Source
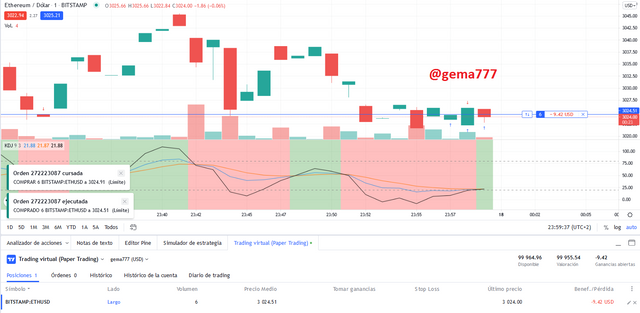
Using the 1min chart to make the exercise faster and to see it more quickly, I will start buying the asset ETH/USDT.
buy trade: I bought 6 ETH long when the KDJ Indicator was oversold and was telling me that the uptrend was approaching so I figured I had to buy at that time. bought 6 ETH for $3024.
Source
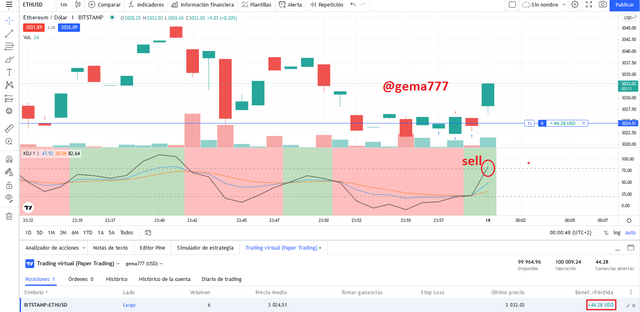
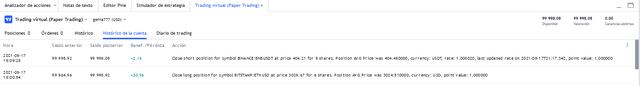
The sell trade was when the J line indicated that I was oversold on the 1min time frame and I sold at 3029 obtaining in the first trade using the KDJ a total of:
making a profit of +$30.96 on the 1min time frame.
Source
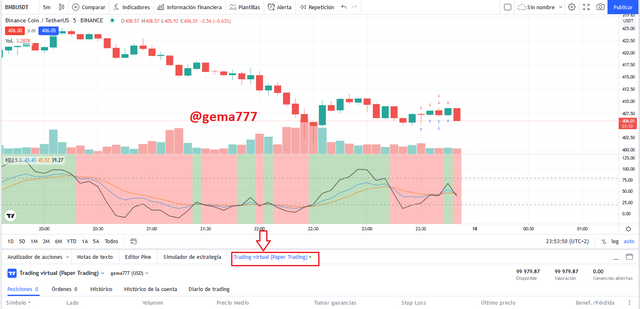
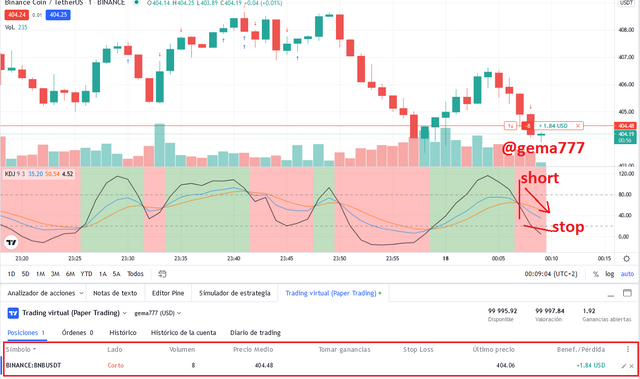
Second trade 1min timeframe BNB/USDT pair
In this opportunity I made a short trade looking at the 1min time frame chart.
I bought at 404.48 and closed at 404.21 obtaining a profit of 2.16$.
Source
Then we see in this illustration the profitability I had using the KDJ indicator in a 1min time frame.
Source
Conclusion:
Today I learned an extremely important information and it was how to work with tradingview with a demo account in short and long, it is fascinating and extremely nice to understand with practice the current market, we also learned a lot about the ADX indicators that tells us the strength that carries a trend and the ATR that tells us the volatility of the market in the temporality where we are operating are 3 very strong indicators that together create a perfect tool for us traders. thank you very much professor and see you in the next season very good job.
Good job @gema777!
Thanks for performing the above task in the eighth week of Steemit Crypto Academy Season 3. The time and effort put into this work is appreciated. Hence, you have scored 7 out of 10. Here are the details:
Remarks
You have displayed a good understanding of the topic Gema. You have completed the assigned task. However, you did not provide the configuration parameters of KDJ indicator in task 3.