[Trading Crypto with Keltner Channels] -Steemit Crypto Academy | S5W6| Homework Post for @fredquantum
KELTNER CHANNELS
Chester W. Keltner developed and presented the Keltner Channel indicator in the mid 1960s, but Linda Raschke refined and improved it in the early 1980s to meet modern trading standards. The Keltner Channel indicator is a volatility-based indicator that consists of three oscillating lines (upper band, lower band, and EMA), with the EMA located in the midst of the upper and lower bands.
The price's exponential moving average (EMA) is the center line. Above and below the EMA, additional lines are drawn. As volatility (as measured by ATR) rises and falls, the bands expand and constrict. Because the majority of price movement will be contained within the upper and lower bars (the channel), moves outside the channel can indicate trend shifts or acceleration. The channel's direction, such as up, down, or sideways, can also help determine the asset's trend direction.
Keltner Channels can be used in a variety of ways, depending on the trader's preferences. With a longer EMA, the indicator will have greater lag, and the channels will not react as rapidly to price changes. The bands will react quickly to price fluctuations with a shorter EMA, but it will be more difficult to determine the true trend direction.
A larger ATR multiplier used to construct the bands will result in a larger channel. The price will be able to hit the bands less frequently. A smaller multiplier indicates the bands are closer together, and the price is more likely to reach or exceed the bands.
Traders can customize their Keltner Channels in whatever way they choose, but keep the following uses in mind:
1.If the price keeps touching the upper band but not the lower, it could be a warning that the uptrend is losing momentum when the price finally reaches the lower band.
2.If the price is consistently touching the lower band but not the upper, it could be a hint that the downtrend is nearing its end if the price finally reaches the upper band.
3.Price strength is shown by a move above the top band. Another sign of an upswing is a channel angled upwards.
4.Between the top and lower bands, the price may swing. Traders can utilize the bands as support and resistance in these types of situations. They can consider buying when the price reaches the lower band and then begins to rise again, and selling or shorting when the price begins to fall after reaching the upper band.
5.If the price breaks above or below the channel after a horizontal period and the channel begins to tilt in the same direction, it could indicate that a new trend in the breakout direction is starting.
6.The channel's angle aids in determining the direction of the trend. The price has been growing in a rising channel, whereas the price has been falling or moving sideways in a falling or sideways channel, respectively.
7.Price weakening is indicated by a break below the bottom band. This indicates that the market is in a downtrend, especially if the channel is angled downward.
SETTING UP THE KELTNER CHANNELS
To set up the keltner channels on a crypto chart, I will be making use of the tradingview website since it supports the use of indicators. Below are the steps to follow to add the keltner channels indicator to our chart.
1.Visit the tradingview website (www.tradingview.com) and click on the chart bar as shown in the image below
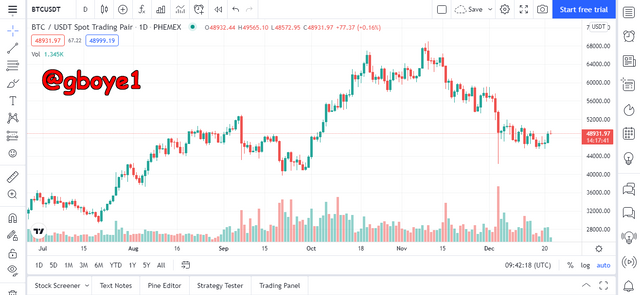
2.Once the above is done, the chart interface will be displayed as shown below
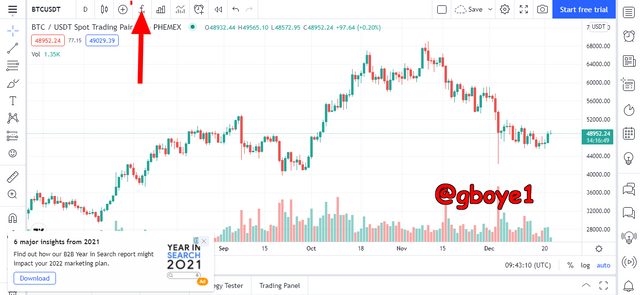
3.Click on the indicator icon to be able to access the keltner channels indicator
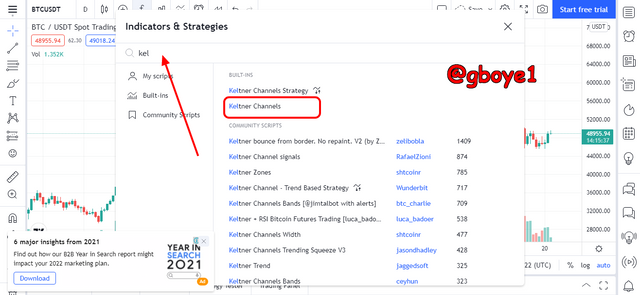
4.A search interface with a list of indicators is displayed, search for the indicator of your choice (the keltner channels)
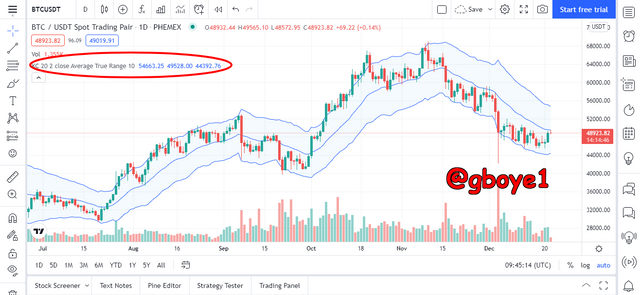
5.As seen below the keltner channels indicator has been added to our chart
CONFIGURING THE KELTNER CHANNELS INDICATOR
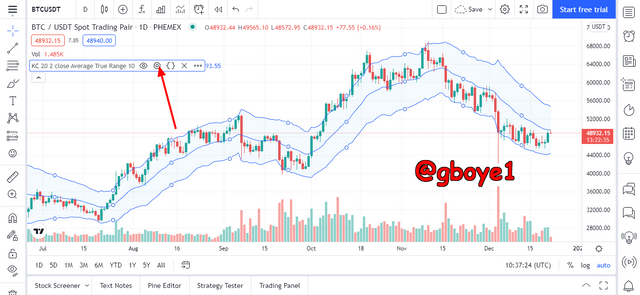
To configure the keltner channels indicator, click on the settings icon as shown in the image below
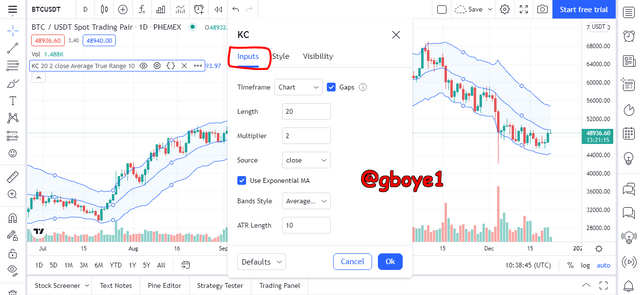
THE INPUTS
The Keltner channel indicator on the appeared inputs tab has a default period of 20, a multiplier of 2, and an ATR length of 10. The indicator period settings can be adjusted to suit the trader's trading system and approach.
THE STYLE
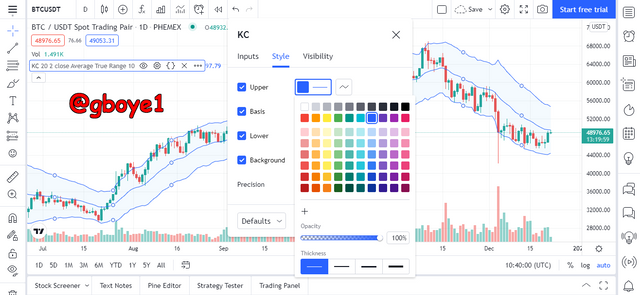
The Keltner channel indicator curve color, thickness, and precision for the upper bounds, lower bounds, and the EMA can be adjusted under the Style tab to meet the trader's preferred criteria.
THE VISIBILITY
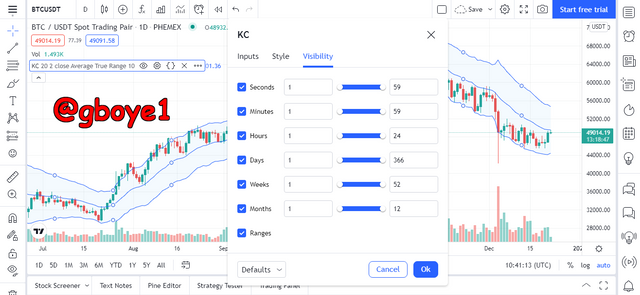
I allowed the visibility feature to remain its default settings
The Keltner channel indicator comes with a default period observation of 20, a multiplier of 2, and an ATR value of 10, but the ideal setting is determined by the trading system and the type of asset traded. Shorter indicator durations are used by short-term traders, whereas longer indicator settings are used by long-term traders.
Backtesting the indicator technique and determining the Keltner channel indicator behavior when paired with other technical indicators like as moving averages are two ways to select the appropriate configuration (MA).
CALCULATING THE KELTNER CHANNEL INDICATOR
THE FORMULA
The middle line of the keltner channel is the exponential moving average (EMA)
The upper band of the keltner channel is = EMA+2 x ATR
The lower band of the keltner channel is=EMA−2 x ATR
where:
EMA is the Exponential moving average
ATR is the Average True Range
And the multiplier used is 2
HOW TO CALCULATE IT
1.Calculate the asset's EMA using the last 20 periods or the chosen number of periods.
2.Calculate the asset's ATR using the last 20 periods or the chosen number of periods.
3.To determine the upper band value, multiply the ATR by two (or whatever multiplier you like) and then add that number to the EMA value.
4.To determine the lower band value, multiply the ATR by two (or any chosen multiplier) and then remove that number from the EMA.
- After each period, repeat all processes.
EXAMPLE
A BTCUSDT chart has the following price readings:
EMA period =20
ATR length = 20
Multiplier = 2
The Keltner channel indicator will be calculated as shown below:
The Middle line = 20, because of the EMA value that is 20.
Upper band = 20 + (2 × 20)
Upper band = 20 + 40
Upper band = 60
Lower band = 20 - (2 × 20)
Lower band = 20 - 40
Lower band = -20
With the above calculation, the upper band will move upward indicating a bullish trend since the lower band has a negative value.
TREND CONFIRMATION WITH THE KELTNER CHANNELS INDICATOR
Keltner channels is an excellent indicator for confirming a trend. Knowing the direction of the trend is one of the most crucial aspects of trading. It will be quite easy for a trader to place himself in the market once he knows the trend direction. However, he may become upset if he lacks proper and adequate understanding about the trend.
As a result, Keltner is one of the indicators that traders use to figure out which asset is in which trend. With the three lines of angular position of the indicator, the Keltner channel can validate the trend (upper and lower bands, and the middle line). The following are examples of scenarios:
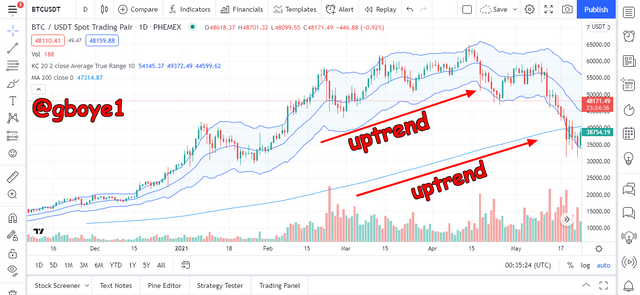
CONFIRMING UPTREND MOVEMENTS
When price makes consecutive higher highs and lows, the Keltner channel indicator lines (upper band, lower band, middle line) move upward in an uptrend. Price formations should ideally be kept between the upper band and the middle line, with the upper band acting as resistance and the middle line as the support.
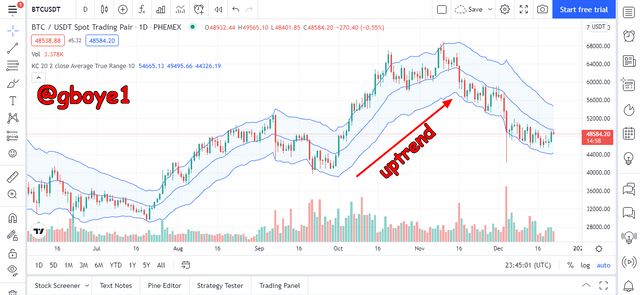
Looking at the image above, the formation of the price stayed between the upper band and the middle band, the upper band serving as the resistance while the middle band serves as the support, this is an uptrend confirmation
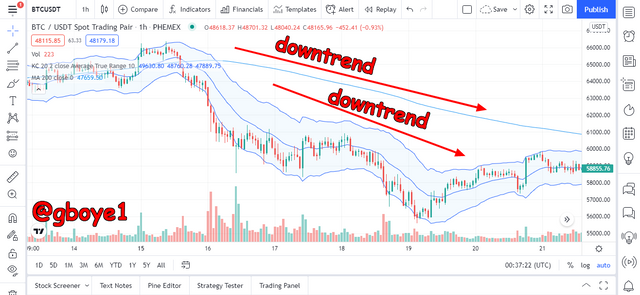
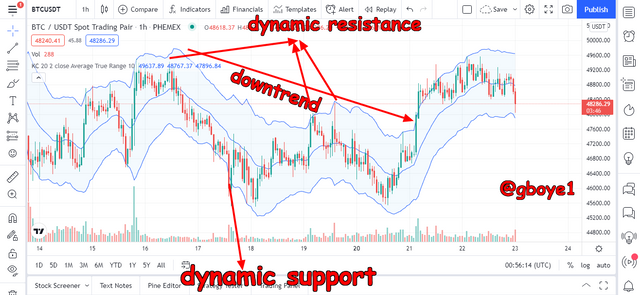
CONFIRMING DOWNTREND MOVEMENTS
As price makes continuous lower highs and lows, the Keltner channel indicator lines (upper band, lower band, middle line) move in a downward direction. Price formations should ideally be kept between the center line and the lower band, with the middle line acting as resistance and the lower band acting as support.
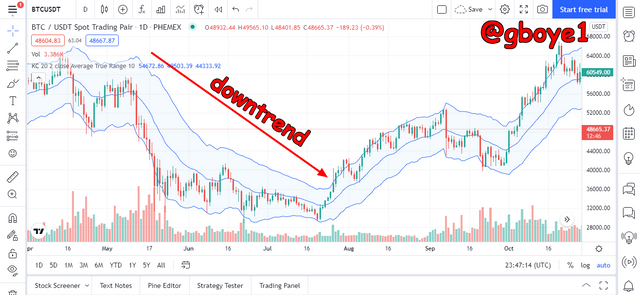
Looking at the image above, the formation of the price stayed between the middle band and the lower band, the middle band serving as the resistance while the lower band serves as the support, this is a downtrend confirmation
THE SIDEWAYS MARKET ON KELTNER CHANNELS
A sideways market is one in which prices fluctuate between resistance and support levels. That is, neither an upward nor downward trend can be observed. During a sideways market, when price hits support, it bounces back and continues upward, whereas when it hits resistance, it is rejected. As a result, this is a market where buyers and sellers are fighting tooth and nail, because sellers want to drive down prices while buyers want to see prices rise.
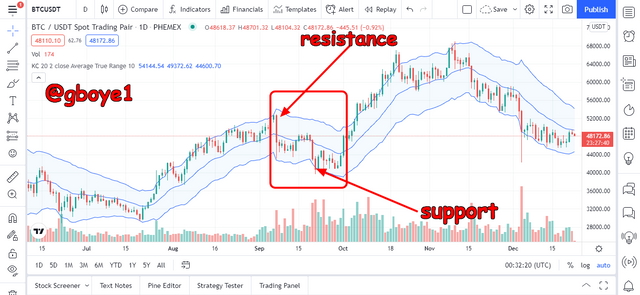
Keltner channels do not show the trend direction during a sideways market, and the angles do not show whether the market is trending upward or downward. Because the angles may be viewed facing both directions, I can conclude that they have no particular direction. During this period, the top band will provide resistance while the lower band provides support.
USING THE MA 200 AND KELTNER CHANNELS TOGETHER
To filter out the false readings generated, the Keltner channel can be paired with other indicators such as a higher period moving average (MA). For this section I will be making use of the MA 200. It is vital to combine these two indicators since relying solely on one indicator can be dangerous because no indicator is flawless.
When using the Keltner channel indicator in conjunction with the MA 200, there are a few things to keep in mind
IN AN UPTREND
As will be shown in the image below, for an uptrend the MA 200 will always be seen below the price and the Keltner channel, also the price and the Keltner channel should be going in the upward direction.
IN A DOWNTREND
The MA 200 should be above price and the Keltner channel in a downtrend, with the Keltner channel heading downward.
IN A SIDEWAYS MARKET
During a sideways movement, the MA 200 must be within both Keltner Channels and the asset price, which usually indicates that there is no downward or upward trend, so the movement is usually horizontal, with the asset price forming a support/resistance level with both Keltner Channels.
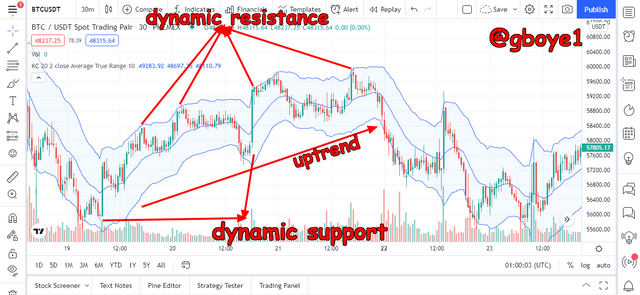
DYNAMIC SUPPORT AND RESISTANCE
Even during a trending market, dynamic support and resistance can be detected. Horizontal support and resistance levels are something that we're all familiar with. That's the popular support and resistance levels, which are frequently denoted with horizontal trend lines. A diagonal trend line can be used as support or resistance in an uptrend or as resistance in a downtrend.
FOR UPTREND
FOR DOWNTREND
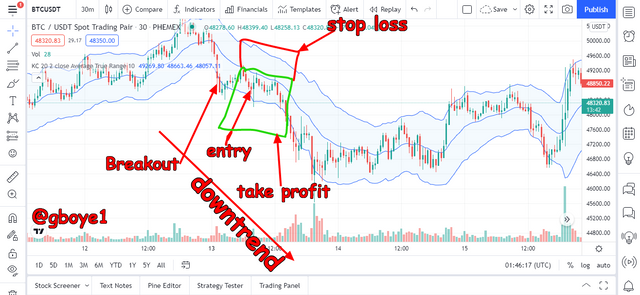
BREAKOUTS IN THE CRYPTO ECOSYSTEM
Breakouts in the crypto ecosystem occur after a period of sideways price movement, in which the price varies within a set of resistance and support levels. The Keltner channel indicator can be used to validate the breakout because volatility must break through either the dynamic resistance or dynamic support levels before the price can continue in a given direction. Price breaches above or below the Keltner channel indicator lines. Because its lines move in the same direction as the breakout, the Keltner channel validates the move.
IN AN UPTREND
Price moves between the upper band and the middle line in an uptrend, as we stated previously. Dynamic resistance is provided by the upper band. When the upper band is broken by aggressive buyers, it means the resistance has been broken to the upside. When the candle closes above the top band, it is considered a bullish signal. We can profit from this by anticipating that if resistance is broken, price will likely continue to rise.
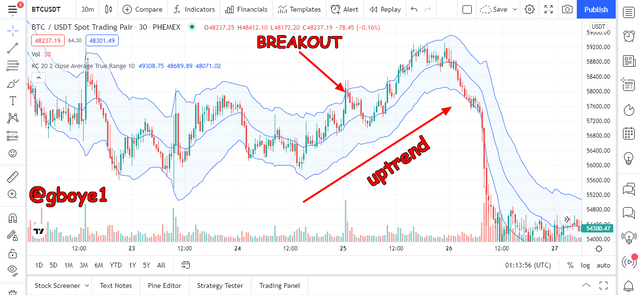
The candle closes over the upper band, as seen in the image below. The resistance has been broken, as evidenced by this. And take note of how the price has risen steadily.
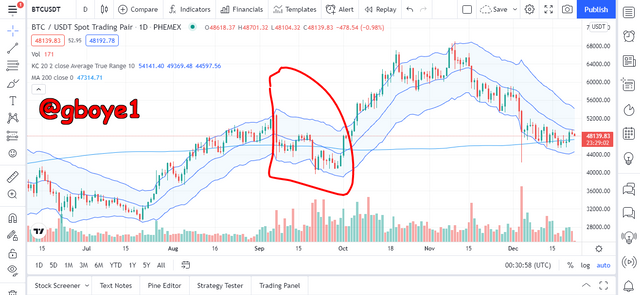
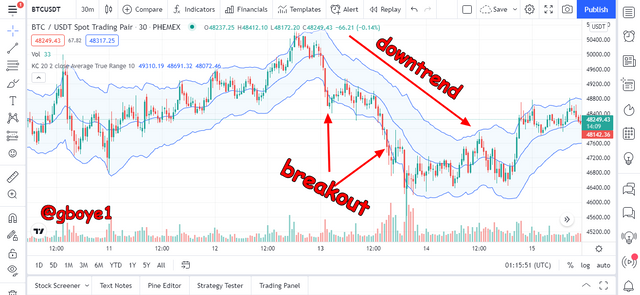
IN A DOWNTREND
The lower band also serves as a support level in a downtrend. The support, lower band, will be breached if the sellers get too relentless. A breakout of support is indicated by a candle breaking below the lower band.
The candle closed below the lower band, as you can see in the image above. This indicates that the support has been breached, as evidenced by the price rallying to the negative.
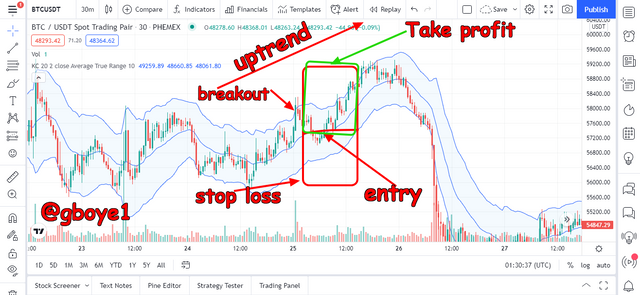
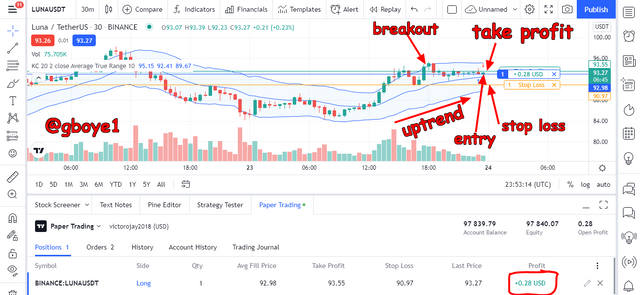
RULES TO FOLLOW WHEN TRADING BREAKOUTS WITH KELTNER CHANNELS IN A BULLISH TREND
The price should be moving between the middle line and upper band. After that, look for a candlestick that breaks and closes above the upper band after a range of price movement.
Then, when you go downward after the breakout, you keep an eye out for price resistance.
The price should then be observed moving between the upper and middle bands, either backward or downward. When the price reaches the middle band and finds support, an entry should be made after two or three upward candles develop.
Use proper risk management techniques, such as placing a stoploss below the middle line to serve as a dynamic support. A positive risk-to-reward ratio, or at least a 1:1, should also be applied.
IN A BEARISH TREND
The price should be moving between the middle line and the bottom band, after that, look for a candlestick that breaks and closes below the lower band after a range of price movement.
Then, as you move upward after the breakthrough, you keep an eye out for price restraint.
The price should then rise between the lower and middle bands. After two or three downward candles develop, an entry should be made when the price reaches the middle band and resists it.
Use good risk management, with the stoploss above the middle line, which acts as a dynamic resistance. It's also a good idea to employ a favorable risk-to-reward ratio, or at the very least a 1:1.
BOLLINGER BANDS VS KELTNER CHANNELS
THE SIMILARITIES
Both indicators have three bands: an upper band, a lower band, and a middle band.
Both types of indicators always suggest an increase in volatility, whereas contraction in both types of indicators always indicates a drop in volatility.
Both indicators are used to determine how volatile a crypto asset is.
DIFFERENCES
The upper and lower bands of Keltner Channels are calculated using ATR, whereas Bollinger Bands use standard deviation.
The indicators have a similar interpretation, but because the calculations differ, the two indicators may provide somewhat different information or trading recommendations. On Keltner Channels, the average of the upper and lower bands is commonly used to calculate the middle line. The upper and lower bands for the Bolinger indicator, however, are commonly calculated by adding or removing 2 standard deviation from the central line.
A breakout outside of the upperor lowerKeltner Channels usually indicates that there was a break as a result of the previous trading range, indicating the likelihood of a new trend emerging. However, a breakout outside of the upper and lower bounds usually signals a trend reversal in the future.
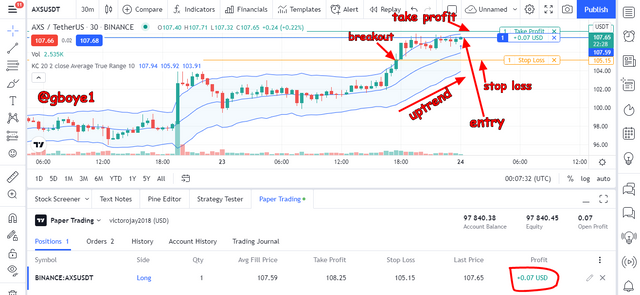
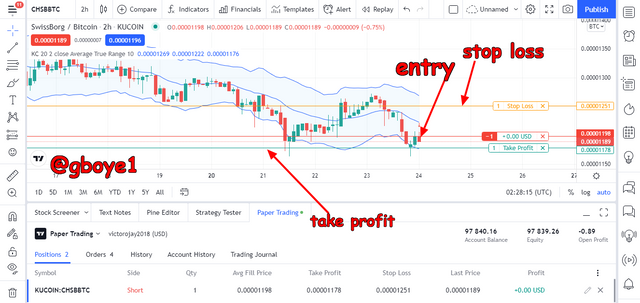
DEMO TRANSACTION USING THE KELTNER CHANNELS INDICATOR
Below are my transactions carried out using the tradingview paper trading feature
LUNAUSDT BUY TRADE
AXSUSDT BUY TRADE
CHSBBTCSELL TRADE
BNBTRY SELL TRADE
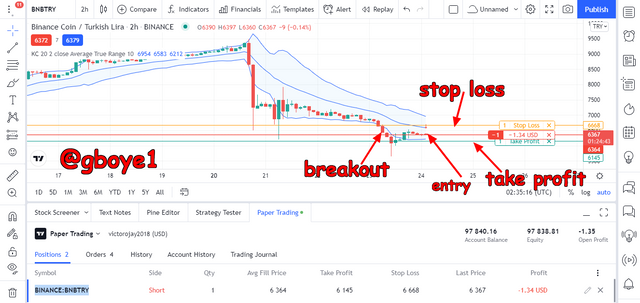
As can be seen from all the above transactions above, all the Keltner channels rules were adhered to.
ADVANTAGES OF THE KELTNER CHANNELS INDICATOR
1.The Keltner channels indicator is extremely simple to read and comprehend.
2.The channels can be utilized to verify a market asset's trend.
3.It's a volatility-based indicator that calculates how volatile an asset is.
4.Traders receive signals when the keltner channels' lower and upper bands break.
5.The indicator is applicable to all timeframes and markets.
DISADVANTAGES OF THE KELTNER CHANNELS INDICATOR
1.When trading in a range market with high volatility and without employing appropriate time frames and setting up the periods to fit the market, this indicator frequently sends out late confirmation of both trend direction and breakouts. We can see that this trader will have a significantly lower risk-to-reward ratio, implying that the trader may incur considerable losses.
2.Because the indicator reacts so quickly to the price of the asset, it frequently generates a lot of false signals, especially when trading at a short time frame.
3.On different timeframes, it does not have the same perspective.
CONCLUSION
The Keltner Channels' usefulness is largely determined on the settings employed. Traders must first select how they will utilize the indicator, and then set it up to support that goal. Keltner Channels can assist determine trend direction and even generate trade signals, but they work best when combined with price action analysis, fundamentals (if trading for the long term), and other technical indicators.
The Keltner channels and the Bollinger bands are both effective for providing signals, although for different purposes. When price action breaks over or below the top and bottom barriers, however, a continuation is preferred than a retracement to the middle or opposite barrier.
Very long post but it was worth it https://9blz.com/bollinger-bands-indicator-explained/