[CRYPTO TRADING WITH CHAIKIN MONEY FLOW INDICATOR]-Steemit Crypto Academy |S4W6| Homework Post for @kouba01
CHAIKIN MONEY FLOW INDICATOR
Marc Chaikin, a well-known stock market technical expert, invented the Chaikin Money Flow indicator. This indicator is designed to determine the amount of Money Flow Volume over a given time period, and it can be used to gauge market buying or selling pressure.
Money flow is one of the most essential variables in anticipating price changes in a commodity market; by understanding how money flows in the market, we can predict prices and identify what trends are developing in the market, and by knowing these two things, we can decide whether to purchase or sell an item. "Chaikin Money Flow" is one of the indicators used to track the flow of money in this market.
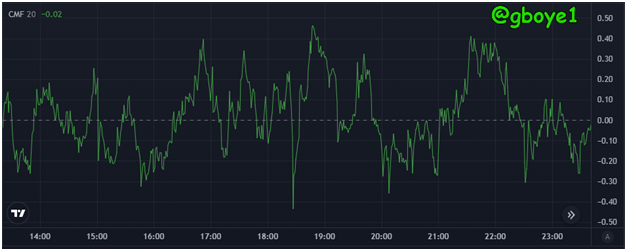
CMF is displayed using a moving line, similar to other indicators, and will show a value ranging from 1 to -1 that indicates the distribution phase, with 0 being the centerline. When the CMF line approaches or perhaps reaches the range's upper limit, namely number 1, it shows that buying volume has increased, resulting in greater buying pressure than selling pressure. If, on the other hand, the CMF line approaches or reaches the lower limit of the -1 range, it indicates a rise in selling volume, indicating that more people are selling than purchasing during that period of time.
HOW TO CALCULATE THE CMF INDICATOR
To calculate the CMF indicator below are the various formula’s that are used;
Money flow Multiplier (MFM)
MFM = (CP - LP) - (HP - CP) / HP–LP
Where:
CP is the closing price
LP is the Low price
HP is the high price
Money Flow Volume (MFV)
MFV = MFM x Volume for the given period.
Chaikin Money Flow (CMF)
CMF =Sum of n periods of Money Flow Volume/sum of n periods of volume.
EXAMPLE
So, let's make up some values and input them into the formulas above:
HIGH: $800;
LOW: $400;
CLOSE: $700
THE 21 PERIOD SUM OF VOLUME: $200
VOI UME FOR THE PERIOD: $100.
The Money Flow Multiplier is calculated as follows:
Cash Flow Multiplier = [(700 - 400) - (800 - 700)] / (800 - 400)
Cash Flow Multiplier = 200/400
Cash Flow Multiplier = 0.5
The volume of cash flows is calculated as follows:
Volume of cash flow = 0.5 x 100
The volume of cash flow = 50
Now Calculating of Chaikin Money Flow we have:
Chaikin Money Flow = 50/200
Chaikin Money Flow = 0.25
Therefore from the formula earlier stated we can say that the value of our CMF is:
CMF= 0.25
If we apply this example to a real-world trading market, it means that the market is an accumulation level and that buyers are in charge, as the CMF value is 0.25.
HOW TO ADD AND CONFIGURE THE CMF INDICATOR ON THE CRYPTOWATCH PLATFORM
Below I’ll be adding the CMF indicator to the Cryptowatch platform, showing the step by step ‘how to’
STEP 1:
The first thing to do is to visit the crypto watch website which is (https://cryptowat.ch)
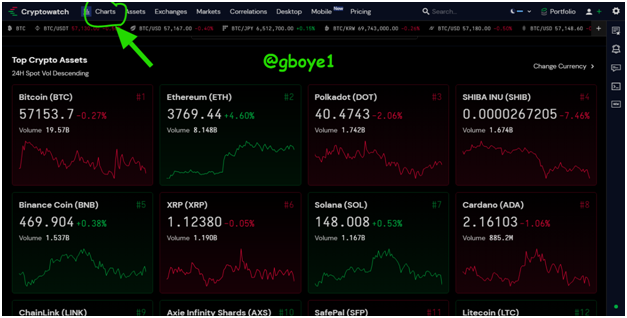
STEP 2:
It will display the home screen of the website, click on charts as marked in the image below
STEP 3:
After clicking on the Chart, it will display a chart screen as shown in the image below
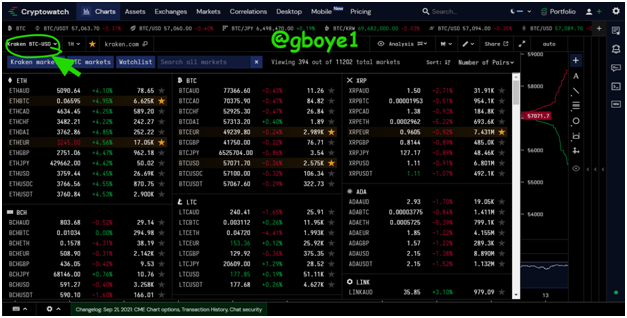
To change to the token of your choice Click on the icon as shown in the image below
STEP 4:
After selecting your desired token, click on Analysis as shown in the image below
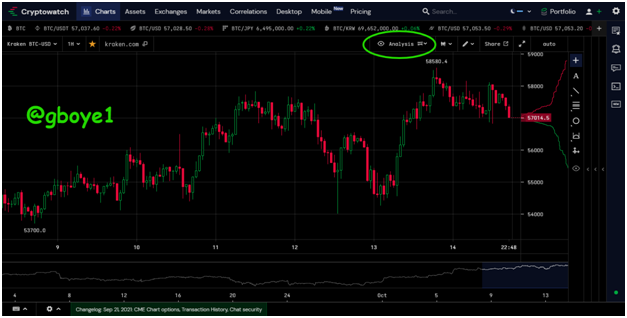
Then, search and select the indicator of your choice just as demonstrated in the image below
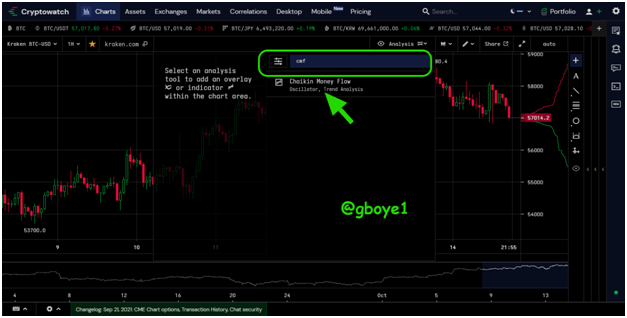
After clicking on the CMF indicator, it is added to your chart
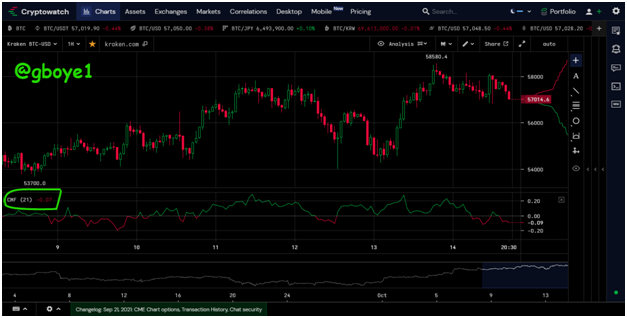
CONFIGURING THE CMF INDICATOR ON CRYPTOWATCH
After you must have added the indicator to your chart, you can configure it to suit your taste and this is done by clicking on the CMF indicator name shown on top of the indicator as marked in the image below
After double-clicking it you can now edit and configure it to suit your taste.
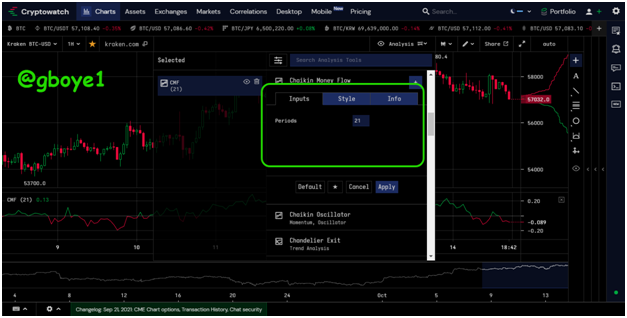
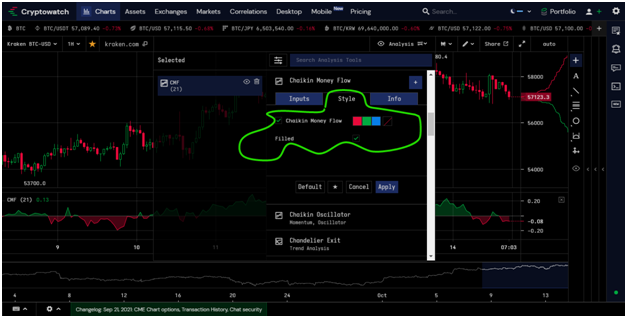
On the Cryptowatch platform, we can configure two items on the CMF indicator. The first is that we may adjust the style so that the CMF indicator is displayed on the graph in the way we want it. On the CMF indicator, we can alter the color of the line.
The period of the CMF indicator is the second set that we may adjust; we can change the period of the CMF indicator according to our preferences on the "Input" menu.
There are various factors to consider while determining the period of the CMF Indicator. The default period of the CMF indicator is 20 or 21, which means it moves based on the data from the previous 20 or 21 periods. This was done since the CMF indicator was designed for the stock market from the start, and as we all know, the stock market has open and shut times, unlike the cryptocurrency market, which is constantly open 24 hours a day, seven days a week. As a result, the number of open days for the stock market in a month is not 30 or 31 days, but 20 or 21 days.
As a result, I believe the recommended setting for this indicator is to first consider each trader's or investor's trading style. If we are a short-term trader, we should pick a shorter duration so that the CMF indicator can see the money movement in the market more accurately. In the meanwhile, long-term traders might choose the default length of 20 or 21 or a longer length to reduce the number of false signals provided by the CMF indicator.
THE ROLE OF THE INDICATOR IN CONFIRMING THE DIRECTION OF TREND AND DETERMINING ENTRY AND EXIT POINTS (BUY/SELL)
The CMF indicator assists us in identifying the market's accumulation and distribution levels, as well as the buying and selling pressure of traders for a certain asset over a given period of time. When there is a lot of accumulation, it suggests the buyers have a good position in the market, but a high distribution means the sellers have control.
The CMF indicator assists in the detection of both bullish and bearish trend directions as seen below:
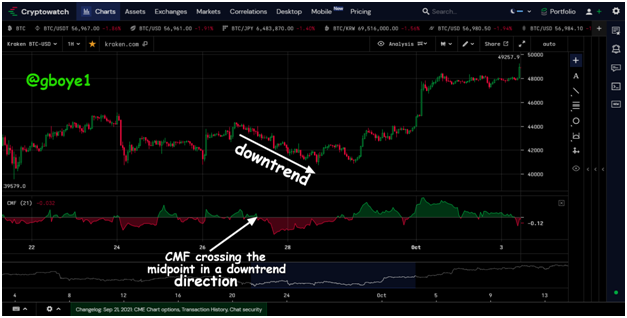
THE DOWNTREND
The CMF line moves below the midpoint, which is 0 in a downtrend. The movement of the line below the midpoint, towards a negative value, indicates market selling pressure, implying greater distribution.
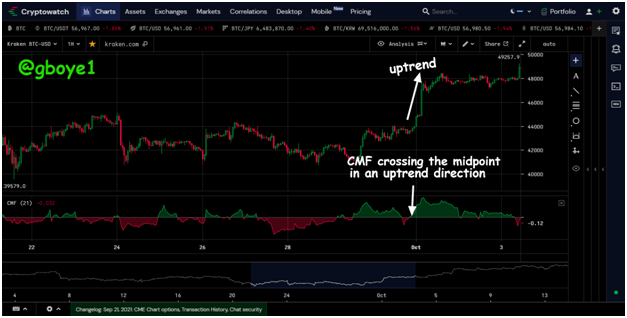
THE UPTREND
The CMF line moves above the midpoint, which is 0, to indicate an uptrend direction. The movement of the line above the midpoint, towards a positive value, indicates that the market is under buying pressure, implying that there is higher accumulation.
BUY ENTRY AND EXIT POINTS
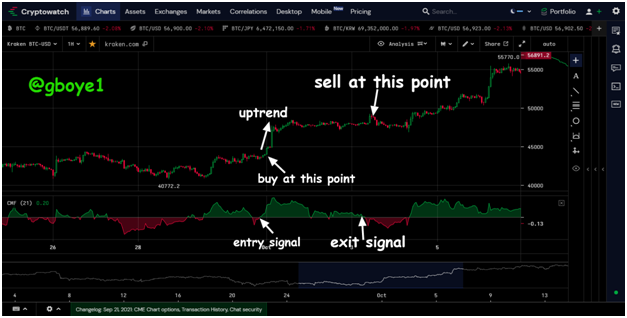
We can see that the entry and exit points in the demonstration above are excellent. When the CMF indicator crossed the middle in an upward direction, the entry point was created, and the price followed suit. When the CMF indicator crossed the midpoint in a downward direction, the exit point was displayed.
SELL ENTRY AND EXIT POINTS
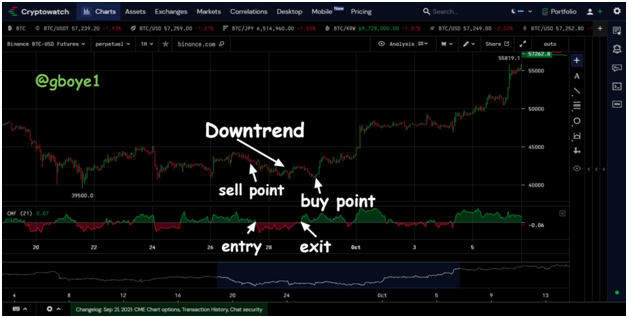
We see excellent entry and exit points in the illustration above. The entry point was obtained when the CMF indicator crossed the midpoint towards the negative value, indicating a bearish price movement, allowing us to profit from our sell trade, and the exit point was obtained when the CMF indicator crossed the midpoint again, indicating a bullish price movement, allowing us to exit the trade.
TRADING WITH DIVERGENCE BETWEEN CMF AND PRICE MOVEMENT
When the asset price and the CMF indicator do not comply with each other, a divergence signal is generated. This implies that the price moves in one direction while the indicator moves in another. This means that the market's buying or selling pressure is decreasing.
Through the trend divergence signals, which are bullish and bearish divergences, we can get early entry and exit signals using the CMF indicator. A trader can get an early opportunity on his trade by using divergence signals.
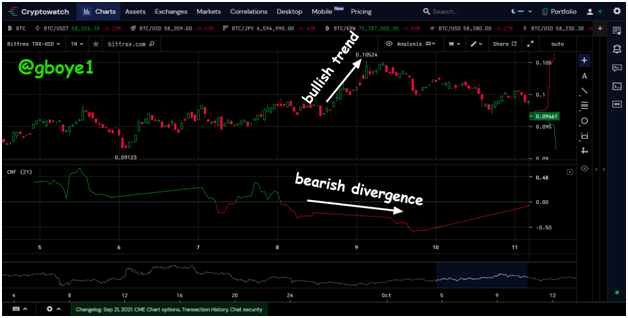
THE BEARISH DIVERGENCE
A bearish divergence occurs when the current trend direction in the market is bullish, but the line on the CMF indicator goes in the opposite direction towards the bottom, indicating a bearish trend.
At moments like these, it's a sign that market conditions have become overbought, and the market is beginning to change from buyer to seller dominance. This indicates that a significant trend reversal will occur in the near future. And, as we can see in the chart above, the TRXUSD price has dropped significantly since it was first in a Bullish Trend, which has now turned into a Bearish Trend.
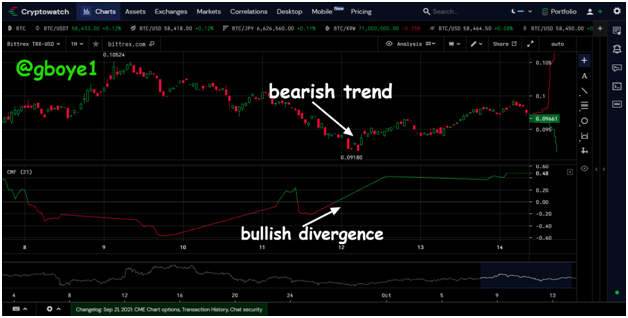
THE BULLISH DIVERGENCE
A bullish divergence occurs when the current trend direction in the market is bearish but the line on the CMF indicator goes in the opposite direction towards the top, indicating a bullish trend.
When the market is oversold, the market begins to move from seller dominance to buyer dominance. This indicates that a substantial trend reversal is likely in the near future.
FALSE SIGNAL BY CMF INDICATOR
Despite the fact that divergence is a rare occurrence, it is sometimes used as a momentum point for entering a trade. However, we must be cautious when employing this divergence trend, as the momentum signal it generates is not a trend reversal indication.
No indicator delivers 100% accurate signals or shows trends; it may be correct occasionally or frequently, but traders have lost money as a result of false signals. Because Chaikin Money Flow Indicator can produce false signals, it is not recommended to use it as a stand-alone indicator.
To receive the proper signal, one should utilize one or more indicators with the Chaikin Money Flow Indicator. When we use several indicators, the signals might be more accurate because if one indicator gives a false signal, the other will correct it. As a result, it's a good idea to pair Chaikin Money Flow Indicator with other technical indicators.
CONCLUSION
Although there are divergent most of the time, which may be filtered with the help of other indicators such as RSI, EMA, and others, the CMF is a good indicator in terms of its capacity to predict signals. Trading on divergence is riskier than trading with a more indicative trend. When the indicator is between -1 and 1, it suggests a strong bear trend, and when it is between 1 and 2, it suggests a strong bull trend. A trader who uses this indicator effectively will almost certainly make profits in at least 90% of his or her trades.
Hi @gboye1
Thanks for participating in the Steemit Crypto Academy
Feedback
Total| 7/10
This is good content though your article lacked an in-depth analysis in regards to Trading using the Chaikin Money Flow Indicator.