S & P Chart and More
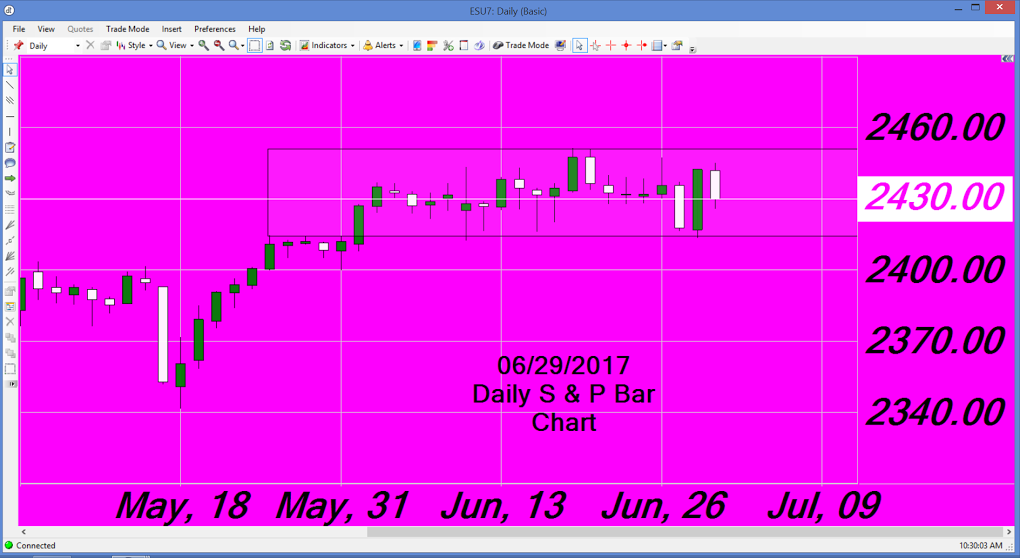
This screenshot was at 10:30 am. Eastern Time. Look at the little time indicator at the bottom right hand corner of the chart.
Since I am shutting down for the week, I wanted to show one more time what the chart is showing. As you know, the chart is a S & P Daniels Trading futures trading chart.
The trading range on the S&P was started on June 1 2017 has been in sideways trading since. You can clearly see the trading range that I have shown on the chart.
Yesterday, it looked like it was going to violate the trading range on the downside. But, it turned around rather quickly. Too quick for my thinking.
So watch today to see if the trading range is going to be negated by the closing price. Above or below. Tomorrow will also count for the month. Otherwise, the month of June is/will be a sideways trading action for the S&P futures.
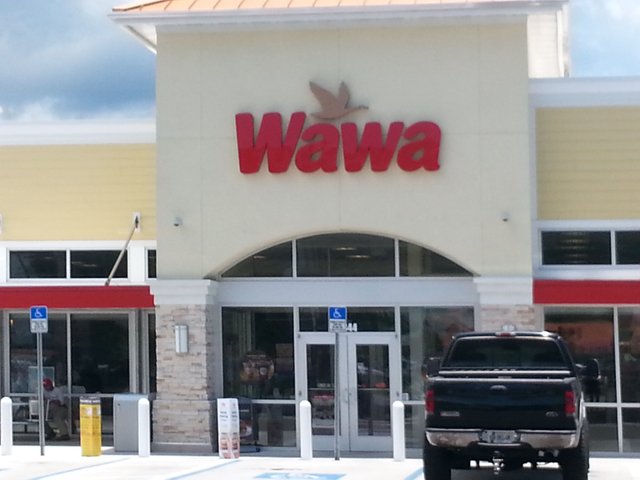
This little photo below will show you that I have made preparations for leaving here soon.
Yes, it takes gasoline. The Wawa gas station is just a start of purchase pain. Ha
I have enjoyed posting content on Steemit for you to read and follow some of my daily life.
As you know. That is about to change. This will be the last post for two or three days, or more.
Thank you for the support you have given to me. The Steemit family is the best.
Francis
Got it.