STEEM-flow weekly report #7
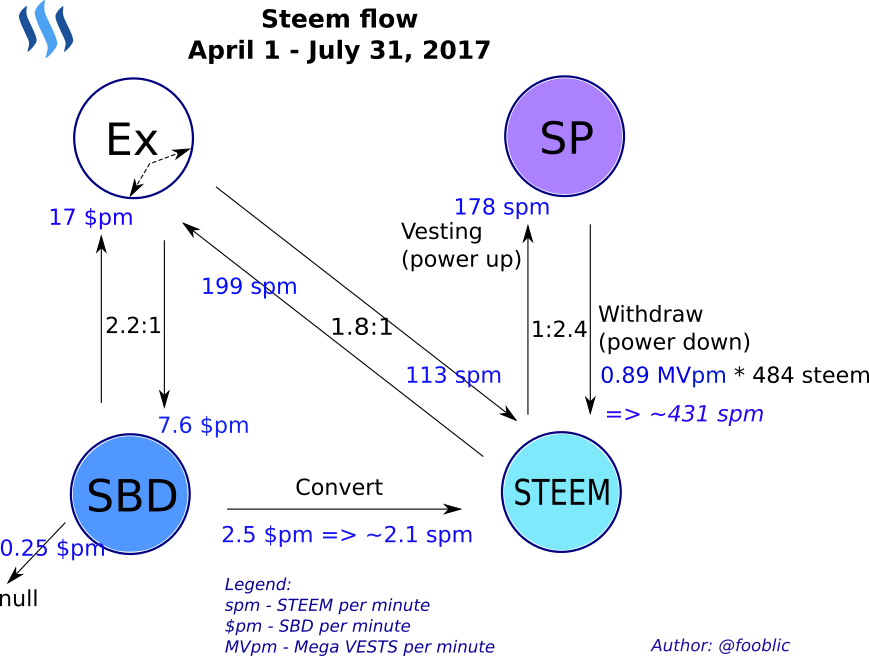
Average STEEM flow intensity for last 4 months:
My previous report -> STEEM flow report #6
After several peaks in the beginning of June, the market is relaxing and goes slightly down. Last month all attention was attracted to Bitcoin Hard Fork. Investors probably transfered assets to BTC in desire to get Bitcoin Cash (BCH) from the Fork for free. Let's see how it influenced to STEEM market.
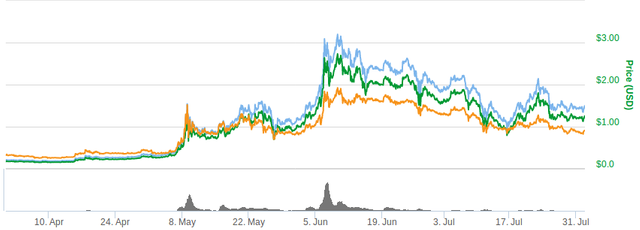
Price chart: coinmarketcap.com
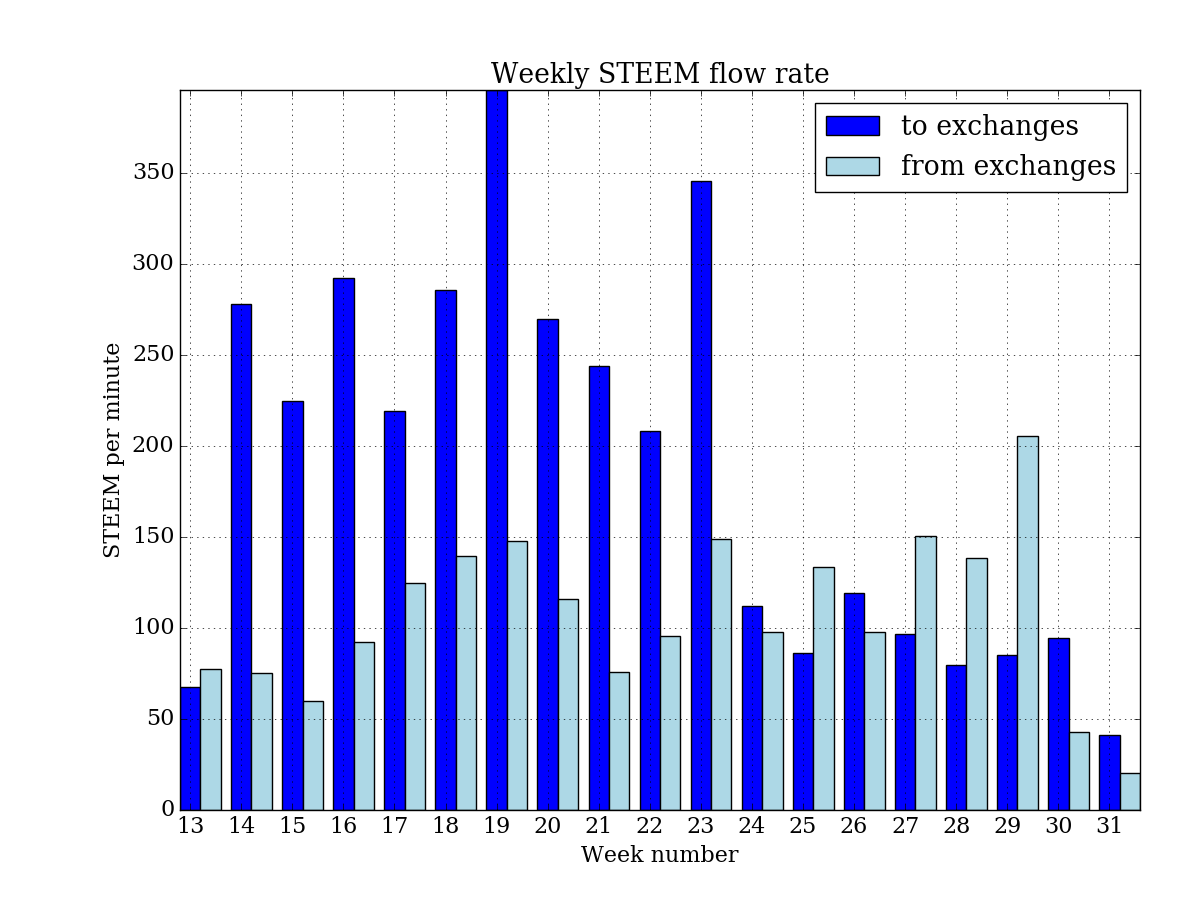
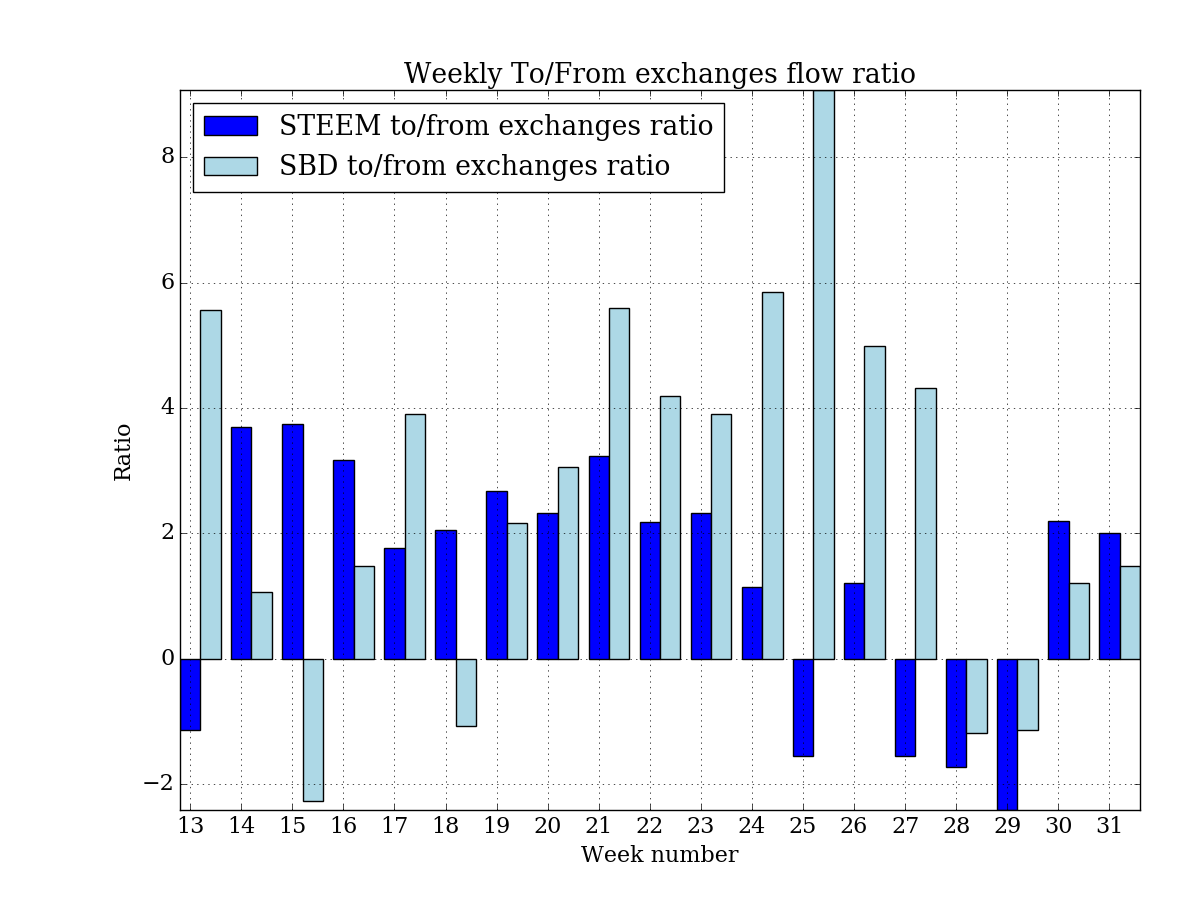
STEEM is massively streaming to exchanges till the week 24 (June, 12), then it mostly streams in another direction from exchanges and I would say the activity almost stop at the end of July. Steemians sold STEEM on spike with high price on exchanges and buy back cheaper lately. What is next step? Investors will sell BCH and vest to altcoins?
SBD price on exchanges keep more than 1.5 USD till the and of June, so it was profitable to sell it out. Then SBD price dropped to less than 1 USD now and we see SBD tokens are returning from exchanges to internal.
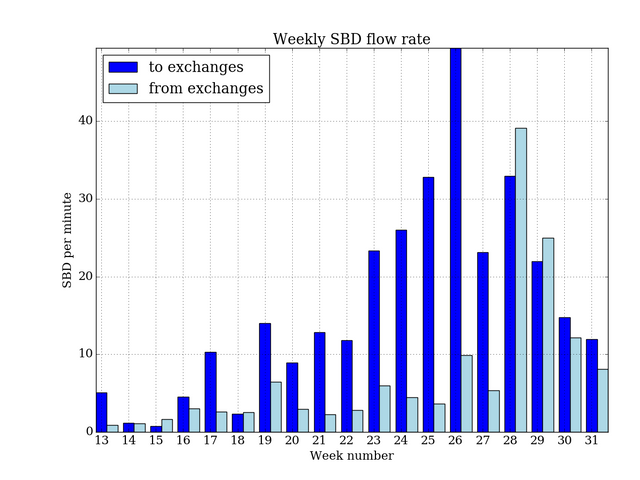
Last month we see some weeks when STEEM & SBD flows prevails in direction from exchanges.
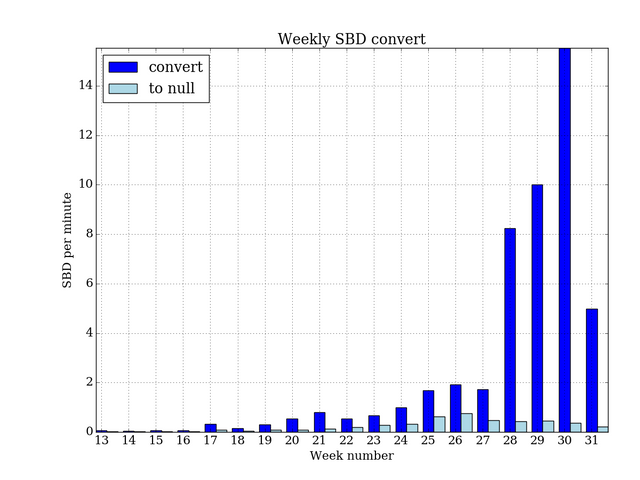
Last 4 weeks SBD internal conversion intensity rate increasing in several times. SBD feed price base ~1.2 USD looks more attractive than conversion on exchanges!
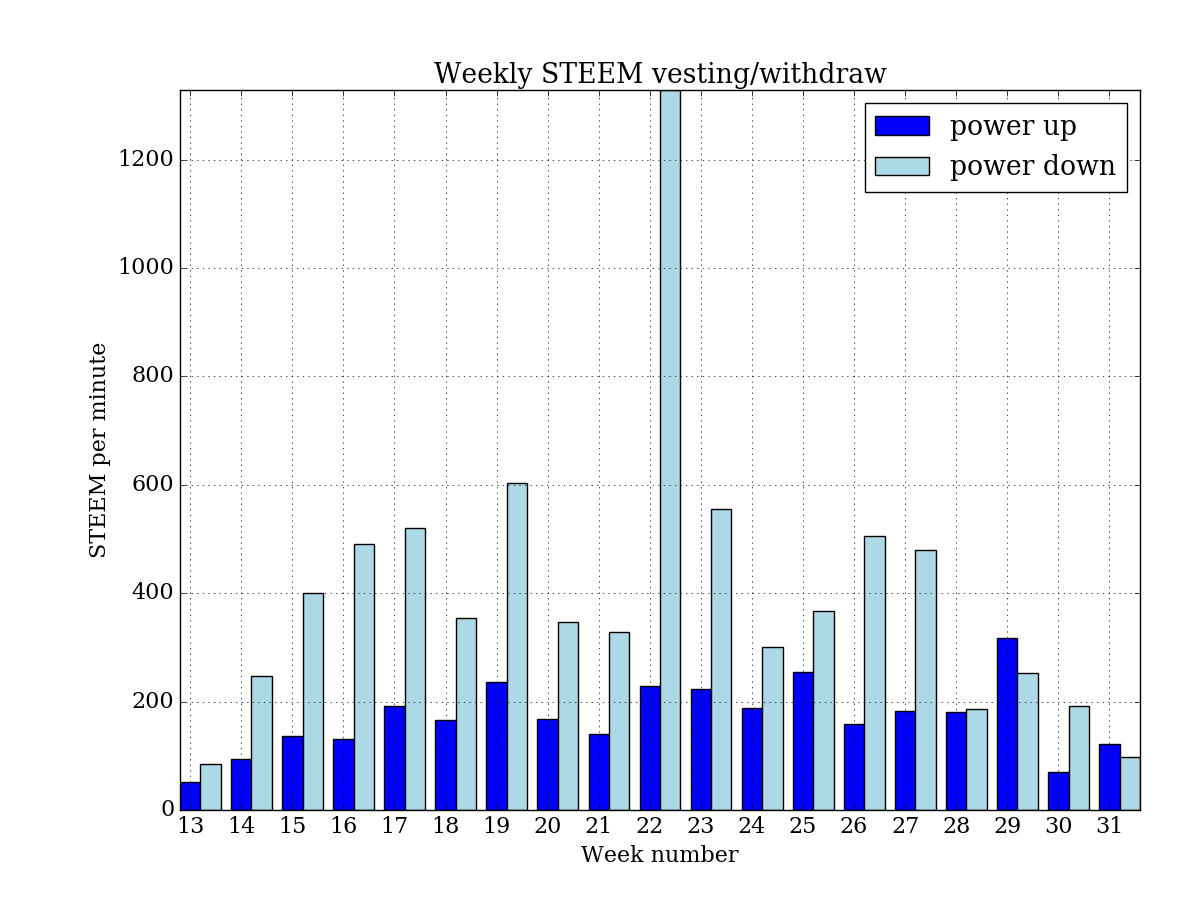
Some last weeks SP vesting volume was more than withdraw, but withdrawals as usually excel.
Excellent recap of the Steemit situation, real numbers, real value... upvote a 100% , great job
Thank you a lot!