Crypto Academy Season 6 Week 4 Homework Post For Prof @fredquantum - Crypto Trading Strategy with Triangular Moving Average (TRIMA) Indicator

My understanding of the TRIMA indicator?

Some moving average weigh recent data more heavily in order to respond more quickly to changes in price the triangular moving average (TRIMA) weighs all data equally emphasizing the middle range of data which results in a smoother line and more conservative read on price changes this is conservative due to the fact the it's reading does not only come from the emphasis on the middle range of data but also due to the fact that two averages occur first the simple moving average are collected and this are averaged which means that in a violatile market the indicators will not indicate a trend until the data overwhelmingly demonstrate a positive direction.
TRIMA works well with other indicators especially as a means of evening out whipsaws with a recently readed EMA and can be used with moving average of different periods to generate crossovers. TRIMA provides effective data smoothing for violatile market and works well with moving average weighted to emphasize more recent data as a way to filter signals in the trading range.
TRIMA provides a conservative valuation of the strength of new trends by checking them against the evenly weighted spread of recent data and provide signals similar to other moving average where they can act as support or resistance lines when the moving average is beneath a positive trend will serve as a support line and if the price dips back should be supported and bounce off even higher whereas a resistance line occurs when a moving average above a negative trend and we could only buy here if the price where to punch through the resistance line
Settingup a crypto chart with TRIMA. How is the calculation of TRIMA done? Give an illustration. (Screenshots required).
Adding of TRIMA on a crypto chart is quite easy whilst i arrived at the charting page of trading view https://www.tradingview.com on any chart in particular i click on indicator and then i will simply add triangular moving average
The pic below shows me adding the TRIMA

Now after after it on the chart it displays on my chart that indeed is typically how the triangular moving average appears on a crypto chart yes it is similar to other moving averages

How Is TRIMA Calculated
Well TRIMA is more of an average of an average of the last N price, what do i mean that is to obtain TRIMA we need to first put into consideration the SMA that is to say we have to calculate the SMA first
SMA = (P1 + P2 + P3 + P4 + _ + Pn)/N
where P1_4 = Represent the price of an asset at the four consecutive periods
Pn = The price of an asset at the last period to be considered
N = The total no of periods under consideration
Now the above formula is how we get our SMA, now to get our TRIMA we simply take the average of all the SMA values
TRIMA= (SMA1 + SMA2 + SMA3 + SMA4 _ +
SMAN)/N
Thus we can simply express it as;
TRIMA = SUM(SMA values)/N
Identifying uptrend and downtrend market conditions using TRIMA on separate charts.
We do know the fact the the TRIMA is similar other moving average and as such can be used to determine trends in the market as the market is mostly either in an uptrend or downtrend we could spot out each of this trend by using the triangular moving average which pays attention to all data's equally.
For An Uptrend
Well to spot out an uptrend using a triangular moving average is quite easy, after choosing for a particular time period depending on our preference and what we are hoping to achieve if we notice that the TRIMA is below a positive movement then that's and indication of an uptrend as it will now acts as support for the trend so to speak. In the pic below i Identified an uptrend in the chart of dogeusd on the 1 hourly timeframe using the 10 period

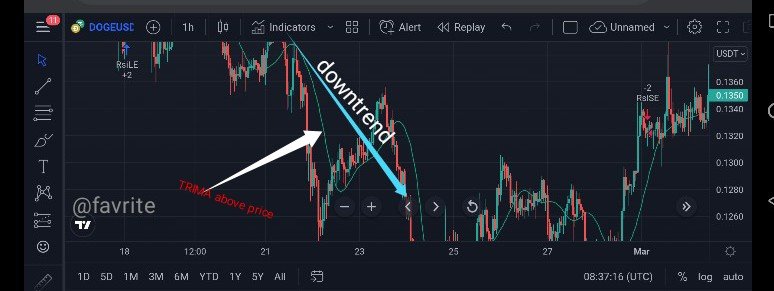
For A Downtrend
This is also very similar like the uptrend only that in an uptrend the TRIMA is usually above the current price of negative price movement acting as a resistance so to speak and from the pic below i have rightly Identified the downtrend on klayusd chart on the hourly timeframe
With My knowledge of dynamic support and resistance, show TRIMA acting like one. And showing TRIMA movement in a consolidating market. (Screenshots required).
When we refer to dynamic support and resistance we are talking about the type of support and resistance common among moving averages yes it's quite unlike our text book horizontal support and resistance line but in this case it is being identified differently, when the TRIMA indicator is below the price it shows the the market is in an uptrend and if the price were to retrace and continuously bounce off upon reaching the TRIMA below then in this case the TRIMA now acts as support upon which the price bounce off to continue in the already established trend and when the TRIMA is above the price and the price always gets rejected whenever it gets to that level then the TRIMA now acts as a dynamic resistance so to speak
TRIMA Acting As Dynamic Support

Well we can see that the price is in an uptrend with the TRIMA below the price and the price occasionally coming down and each time bouncing off of the TRIMA indicator hence the TRIMA acts as a dynamic support in this instance
TRIMA Acting As Dynamic Resistance

Here we can also observed that the TRIMA indicator was above the price and each time the price reaches that level it bounce back the price it's clearly in a downtrend and it's getting rejected upon reaching the TRIMA level hence the TRIMA indicator in this instance acts as a typical dynamic resistance
TRIMA In A Consolidating Market

Well in a consolidating Market the price movement is really unsure the price is neither in an identified uptrend or downtrend is merely bouncing of between support and resistance kind of like ranging withing a specified area before eventual breakout, now in this case the TRIMA indicator is basically moving sideways up and down between the price action as a trader i don't think this will be right time to trade it's much better to wait for the market to choose a path
Combinning two TRIMAs and indicate how to identify buy/sell positions through crossovers. Note: Use another period combination other than the one used in the lecture, explain your choice of the period. (Screenshots required).
The TRIMA indicator is one used to determine the market trend and true as is often the case at times moving averages do lag behind but by combining two TRIMA on a chart it will help to better filter the noise and help us to identify when a trend is likely coming to an end or beginning depending on what format the crossover do occur, i will be using the 100 and 80 TRIMA period in this instance the 80 as my shorter period and the 100 as my longer period
For Buy Position
When we combine two TRIMA on a chart there is one sure way to know for a fact that it's a strong indication to buy or long an asset as the case maybe we should take a look at the two periods depending on how we set it if the short period punches through the longer one it's a strong buy signal or indicator

The pic above depicts this in the above pic it is observed that the 80 period did crossover the 100 period signalling or kick-starting a bullish rally and have we been observant and entered at the point of the smaller moving average crossing over the longer moving average then it would have been a nice buy position with profits assured
For A Sell Position
Well for the case of a sell position is quite opposite of a long position in this instance the bigger moving average that is the 100 period would be cutting through the smaller period 80 when this happens especially in a downtrend it's a good sell or short signal it is time for buyers who have ride the market to the top to dump or sell short on futures

If we look at the above pic it is very clear that the market is in a downtrend and shortly afterwards the bigger period cut above the smaller one yes the 100 period moving average did cut above the 80 shorter period moving average and at this point it signals sell or shorting opportunity for those that wants to enter the position but this actually creates a good selling position.
This is typically how to use two TRIMA indicator and enter a buy or sell positions using crossovers
Conditions which must be satisfied to trade reversals using TRIMA combining RSI? Show the chart analysis. Another momentum indicator that can be used to confirm TRIMA crossovers? Show examples on the chart. (Screenshots required).
In trading reversal there are conditions that must be satisfied when using TRIMA indicator in conjunction with the RSI indicator we will be looking at both the bullish case and bearish case
For bullish condition
Our two TRIMA's must be added to the chart which i have the 100 period and 80 period
My RSI indicator should also be added in the chart
For a bullish reversal to be confirmed then the RSI indicator must reach the oversold level of 30 and below
The lower period must cross over the higher period in my case the 80 period must cross over the 100 to confirm the bullish reversal
Ofourse i will ensure to set my levels of take profit and stoploss, a very tight stoploss slightly below the support level of the two TRIMA crossover
Will ensure my trade has a good risk to reward ratio for me atleast 1:2

From the above chart of eosusd we can see that the RSI indicator was initially at the oversold level which shows the market was way undervalued which shortly followed by the 80 period which is the shorter period cutting through the 100 period TRIMA which coincided with the RSI indicator hitting oversold and the price action is in an uptrend giving me a perfect condition to put in a buy order from the point of the crossover with my stoploss slightly below
For Bearish condition
The RSI indicator should be added on the chart
Two TRIMA should be added on the chart a short and a long period
The RSI indicator must hit the overbought area to show the market is greatly overvalued hence signalling underlying weakness
the longer period must cut above the shorter period
When there is a breakout ensure the breakout candles stick is thick enough for strong confirmation
Proper stoploss slightly above the cross over with a risk reward ratio of 1:1 or 1:2 or as we may fancy

From the chart we see the market was formerly in an uptrend with the RSI indicator showing price to be way overbought and then the 100 period did cut above the 80 period as i did set it the cutting of the longer period through the shorter period signals a down side which coincided with the RSI indicator after it shows overbought and we can see the price dipping and i placed a sell order stoploss slightly above the crossover resistance line
Now another momentum indicator that can be added to the TRIMA indicator to confirm the cross over is the ADX ( average directional index) this is a useful momentum indicator that simple help us to determine how strong a trend really is depending on the strength of the trend that should give us more confidence of entering a trade with better assurance it won't be a fakeout yes the adx indicator really help us determine the strength of a trend so to speak in an event that it's below 20 that shows weakness of trend but when it's above 25 that shows underlying strength of the trend
Bullish Case TRIMA & ADEX

From the chart we could see after the crossover at the beginning of the uptrend the ADEX indicator was well above 25 showing for a fact that the move is a valid one and there is strength in that trend which would act as an acted boost in confidence for a trader looking to enter a long position
Bearish Case TRIMA & ADEX

In this case also after the longer period cut above the shorter one pushing the price down the ADEX indicator confirm this trend and kind of added validity to it which shows that for a fact the trend is strong hence i placed a sell order with stoploss slightly above the crossover
Placing a Demo and Real trade using the TRIMA reversal trading strategy (combine RSI). Ideally, bullish and bearish reversals. Utilize lower time frames with proper risk management. (Screenshots required).
A Demo trade using TRIMA Reversal strategy with the RSI indicator
For the demo account i will be doing the bullish reversal

This analysis was carried on the chart of Luna on the 15mins timeframe and from the chart the market was observed to be previously in a downtrend as the RSI indicator was indicating oversold followed by the shorter period cutting above the longer period which signal a bullish Reversal so i quickly did my trade setup for buying long i went to my mt5 mobile trading app using demo account i executed a buy order on Luna USD with entry at $88.8 stoploss at $87 and takeprofit at $89 in what was a good risk to reward ratio.
 Mt5 screenshot
Proof of my trade on demo account mt5
A Real Trade
For the real trade i will be executing a sell order in what will be a bearish reversal

This is the trade of ftmusd on the 5mins timeframe i observed the market was formerly in an uptrend but using my TRIMA indicators i also saw the longer period cutting above the shorter period signalling a bearish reversal and prior to this i observed in my RSI indicator that the market of ftm on the 5 mins timeframe was in a way overbought level that's was added confirmation so i entered a sell position on the price of ftm on my binance exchange
 binance screenshot
I opened the position with $14.7 with 11× leverage with my entry price at $1.225 i entered using market order.
 binance screenshot
Proof of transaction on binance exchange
The advantages and disadvantages of TRIMA Indicator?
Advantages
the averaging of data twice by TRIMA which results in double smoothing is very useful in a violatile market
When it works with other moving averages indicators it helps to even out whipsaws
it helps in determining the market trend by weighing all data equally
It's also quite helpful in trading as it help us determine areas of support and resistance in what we know as dynamic support and resistance
Combination of two TRIMA could create a crossover which is a power indicator of trend reversal which could help us act accordingly
Disadvantages
Well all moving average always have an issue of being a lagging indicator and sometimes only indicate a trend after it must have played out putting us at risk if we are trading based only on it
Another drawbacks of the triangular moving average is that even though it tells us about trends we can't really use its past record in predicting the future price of an asset
May not quickly respond to price fluctuations in a very violatile market
Conclusion
Well the TRIMA indicator is one of the useful indicator we have in technical analysis and i believe when put to proper use could help us in our trading journey and we should always try not to use it alone if we like using it as it could lag at times like any other moving average might so it's always better to use with other indicators preferably the RSI indicator