Hello everyone. I am very excited to participate in this another week of this amazing community where we are seeing to learn something new. In this week, we have learned "Confluence Trading" from the professor
@reminiscence01. This is my homework post.
.png)
 Question 1- Explain Confluence trading. Explain how a trade setup can be enhanced using confluence trading.
The traders use multiple indicator throughout the world to analyze the market. But relying on a single indicator tool or strategy is dangerous because no tool is 100% accurate. The indicators may produced false results. If we keep on replying on a single tool, we may end out trading with lose. So the best and effective way to analyze the market is to use the multiple tools and strategies.
The Confluence Trading is nothing but a way of analyzing the market by combining multiple tools and strategies. When we analyze the market using more than 1 tool, it is known as the confluence trading. The confluence trading is best to minimize lose and maximize the profit. In confluence trading, the traders use multiple indicators so that if one indicator or strategy produce false result, the false signal is filtered out by other indicator and the trader remain safe from making the wrong trading decisions.
This is best to maximize the profit. The traders enter and exit from the market using the signals which are produced by the multiple indicators. When 2 or three indicators produced the buy or sell signals, it give more confidence to the trader to take a trading decision.
We can combine any tool with any other tool in confluence trading. The resulting strategy which has been developed by you by combining the indicators will be more effective to analyze the market as compare to use just a single indicator. In the below screen short, we can see that the market price is rising upward. But if we look at the RSI indicator, the indicator was showing the oversold signals. The indicator showing that the price was in oversold zone. That's why we should use the confluence trading to analyze the market because no indicator is perfect and 100% accurate to give you the accurate results. When we combine the indicators, we are able to filter out the false signals of any indicator by looking at the other indicators.
In the below screen short, we have combined the market structure strategy with RSI, EMA and bollinger band.
.png)
The bollinger band is very effective and useful indicator which help the traders to get the best entry and exit spots. This indicator helps the traders to analyze the market in efficient way. The traders can predict the future of the market. There are three bands in bollinger bands which are named as upper band, lower band and middle band. When the price is above the middle band, this indicate the uptrend. When the price is lower than middle band, this indicate the downtrend
.png)
The second is RSI. The RSI is very popular among the traders to analyze the market. This indicator helps to identify the market behavior. The RSI is appeared in form of a line which move between 0-100 reading. When the RSI line is between 0-20 reading, this indicate that market is in oversold region. Because of high selling pressure, the price has been declined and now there is downtrend in the market. But when the line is between 70-10 reading, this indicate that the market is in overbought region. There is uptrend is market. This indicator also help to identify the trend reversal. The traders get the best entry and exit spot
.png)
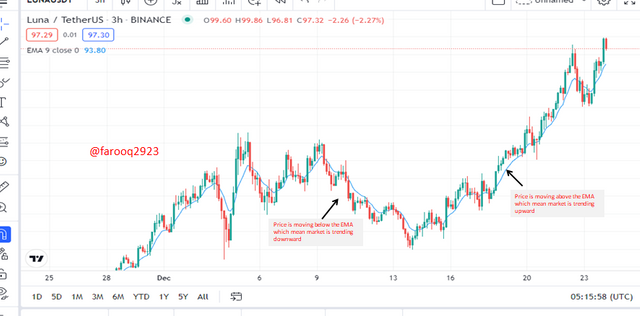
The third is the EMA. This is also appeared in form of a line which move with the price on the chart. When the line is above the price, this indicate the downtrend in the market. When the line is below the price, this indicate the uptrend in the market.
The market structure strategy is the next. When the market is trending upward, some higher high are formed where each high is high than previous high. But when the price fail to form a high higher than previous high, the uptrend end and the market trend change from uptrend to downtrend. This indicate trend reversal. The market structure break out and traders should sell their coins.
Similarly, when the market is trending downward, there are some lower lows where each low is lower the previous low. But when price fail to form a low lower than previous low, the trend reversal occur. The market structure breakout and uptrend is expected in market so traders should buy the coins.
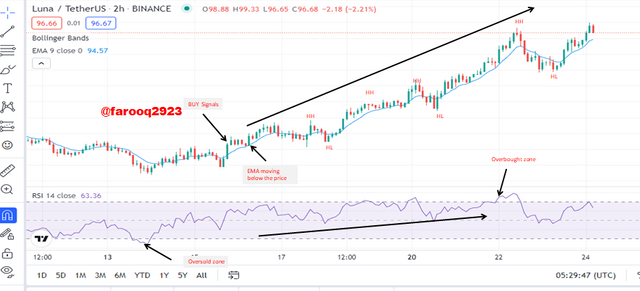
Now let utilize all these indicator on the LUNA/USDT chart
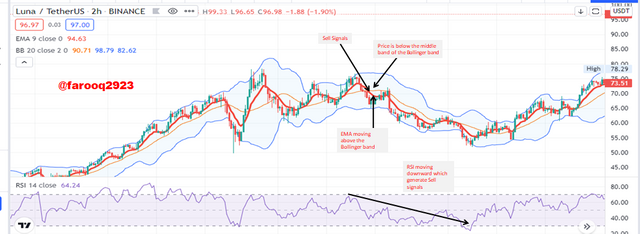
In the above chart, we can see that the price was declining by forming the lower low. Then a new low was formed which was not lower than the previous low. The market structure break out which produced the Buy signals. But we cannot rely on the single strategy. So now we will make the BUY signals sure from the other indicators.
When we look at the EMA indicator, the coin's price first was below the line. Than the breakout occur and the price started moving above the EMA Line which show that the trend has been reversed. The downtrend has been ended and uptrend start. SO this produced the BUY signals.
Then the next is the RSI. The RSI is very useful indicator. This indicator was showing reading which were indicating that market was in oversold region. But then the reading started rising. The line started moving toward the overbought region. This produced the BUY signals.
The last indicator is the Bollinger Band. We can see that the price was first below the middle band. Then the breakout occur and the price moved above the middle band. This show that price is start rising upward which generate the BUY signals.
The BUY signals has been produced by all the indicators. SO the BUY entry is now authentic and accurate because all the indicators and strategies has been produced the same signals. We can now buy the signals to take the profit.
Question 2.Explain the importance of confluence trading in the crypto market?
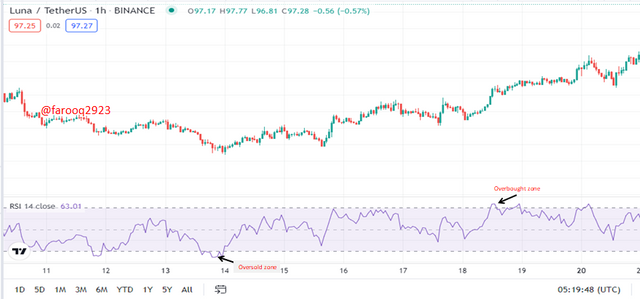
Look at the below chart where the price of the coin was moving downward. There was downtrend in the market. But the RSI was showing that the market is trending upward. This indicator was producing overbought signals. The RSI produced the false signals. The traders who will take the trading decisions using these signals of RSI indicator will face lose. That why we need to use the multiple indicators.
.png)
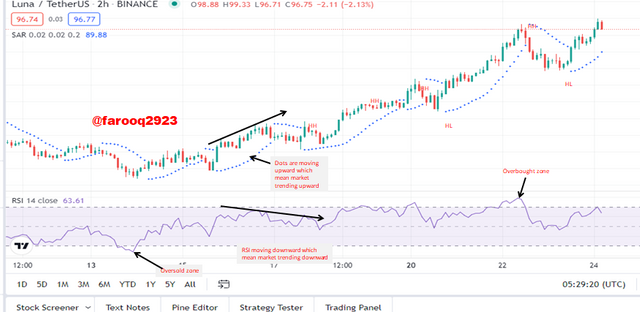
In the above screen short, we have utilize the Parabolic SAR with RSI. When the RSI was producing the wrong output, we can filter out these false signals using the Parabolic SAR. we can see that the price was rising down but the RSI was showing the uptrend signals. When we looked at the parabolic SAR, the direction of the dots was downward which indicate the bearish trend in market. This filtered out the false signal of the RSI indicator and thus helps the traders to safe from the lose because of such false signals.
Advantages
Best Trade Setup
The Confluence trading is extremely helpful to analyze the market in correct way. This help to get the multiple signals which help the trader to make a trading decision. When multiple tools are being used, this become effective and the traders can set up the trade in more efficient way.
Minimize the Loss
The Confluence trading help the traders to minimize the loss. The loss which the traders had because of using the false signals while analyzing the market using single indicator get reduced.
Traders become more confident
The Confluence trading help to build the confidence among the traders to take a trading decisions. When they have multiple tool showing the same signals, they then become more confident to follow those signals
Filter out the false signals
The confluence trading help to filter out the false signals. When we use single indicator, we may get false signals. These false signals may result in lose of trader's money. But when we use multiple indicator, if one indicator produce false result, these can be filtered out by using the other indicator's output. The traders can filter out the false result on the chart of any indicator by using the other indicator signals/.
More effective Output
When the multiple indicators produce the same result, it mean that there are more chances of the market to behave according to those signals. By using those signals, the traders can earn huge reward
Risk Management
This confluence trading help the traders to manage the risk. The traders can manage the risk in more efficient way by using the confluence trading. The volume of loss get decreased thus the users manage the risk in their trading.
Best Buy and Sell Signals
The confluence trading is a combination of multiple indicators. When multiple indicator produced the buy or sell signals at the same time, this mean that buying or selling at that spot will be more profitable for the trader. The confluence trading give best entry and exit spots.
Question 3.Explain 2-level and 3-level confirmation confluence trading using any crypto chart.
2- Level Confirmation Confluence Trading
The 2-level confirming confluence trading is that where the trader use the two indicators to analyze the market. This confluence trading has a combination of two indicators. When both these indicator produced buy or sell signals, the traders place their buy or sell order. If one indicator is producing buy signal and other is producing sell signals, then we shouldn't take any trading decisions and should filter out the false signal using the market price structure. The order is execute only when both indicators produced the same signals
.png)
Above is the chart where we have used the RSI and EMA. The market is rising upward. This mean that the traders should enter into the market. This give the entry signals. But we need to confirm the buy signals using the indicators. When we check the EMA, the price was first below the line which mean that there was downtrend. Then a breakout occur and price started rising upward. This indicate bearish trend has been end and bullish trend has been started. The price started moving above the EMA line which produced the Buy signals.
Now it is time to confirm the buy signals from the second indicator. The RSI is the second indicator which we have been used on the chart. The market was first in the oversold region. Then the breakout occur and the price started rising. The indicator line also started moving upward which indicate the bullish trend. The market started moving toward the overbought region. The traders should buy the coins here to get the high profit.
The buy signals has been produced by both indicators. This mean that the BUY signals is valid here. The traders should buy the coin and should enter into the market to get the high profit.
3- Level Confirmation Confluence Trading
The 3-level confirming confluence trading is that where the trader use the three indicators to analyze the market. This confluence trading has a combination of three indicators. When all these indicator produced buy or sell signals, the traders place their buy or sell order. If one indicator is producing buy signal and other are producing sell signals, then we shouldn't take any trading decisions and should filter out the false signal using the market price structure. The order is execute only when all indicators produced the same signals
.png)
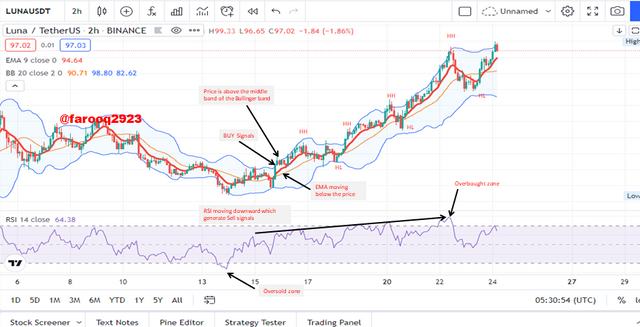
Above is the chart where we have used the RSI, Bollinger and EMA. The market is rising upward. This mean that the traders should enter into the market. This give the entry signals. But we need to confirm the buy signals using the indicators. When we check the EMA, the price was first below the line which mean that there was downtrend. Then a breakout occur and price started rising upward. This indicate bearish trend has been end and bullish trend has been started. The price started moving above the EMA line which produced the Buy signals.
Now it is time to confirm the buy signals from the second indicator. The RSI is the second indicator which we have been used on the chart. The market was first in the oversold region. Then the breakout occur and the price started rising. The indicator line also started moving upward which indicate the bullish trend. The market started moving toward the overbought region. The traders should buy the coins here to get the high profit.
Then at last, we will analyze the market using the last indicator which is bollinger band. The price was first moving below the middle band, then the breakout occur. The bullish trend started and the price started moving above the middle band which produced the buy signals.
The buy signals has been produced by all the indicators. This mean that the BUY signals is valid here. The traders should buy the coin and should enter into the market to get the high profit.
Analyze and Open a demo trade on two crypto asset pairs using confluence trading. The following are expected in this question.
a) Identify the trend. b) Explain the strategies/trading tools for your confluence. c) What are the different signals observed on the chart?
BUY SIGNALS
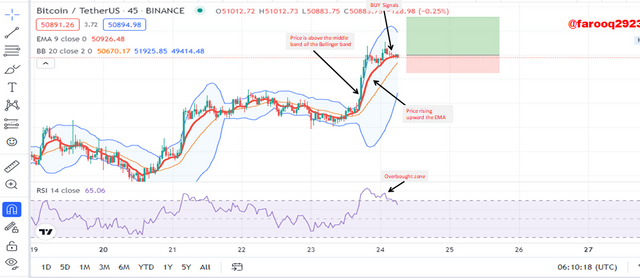
a) Identify the trend.
There is the clear uptrend in the market. The coin was in downtrend before this. There were lower low moves in price of the coin. Then the lower low formed which which was not lower than previous low. This breakout the market structure. The price started rising upward. This indicate that the bearish trend has been reversed into the bullish rend. The traders should enter into the market by buying the coins.
.png)
b) Explain the strategies/trading tools for your confluence.
I have been used the 3- level confirmation confluence trading where i have combined the EMA, RSI and bollinger band. I will use all these indicators to analyze the market. If all these indicators produce the BUY signals, i will enter into the market by buying the coins.
All these indicators are very useful and popular in the crypto world. The bollinger band is very effective and useful indicator which help the traders to get the best entry and exit spots. This indicator helps the traders to analyze the market in efficient way. The traders can predict the future of the market. There are three bands in bollinger bands which are named as upper band, lower band and middle band. When the price is above the middle band, this indicate the uptrend. When the price is lower than middle band, this indicate the downtrend
The second is RSI. The RSI is very popular among the traders to analyze the market. This indicator helps to identify the market behavior. The RSI is appeared in form of a line which move between 0-100 reading. When the RSI line is between 0-20 reading, this indicate that market is in oversold region. Because of high selling pressure, the price has been declined and now there is downtrend in the market. But when the line is between 70-10 reading, this indicate that the market is in overbought region. There is uptrend is market. This indicator also help to identify the trend reversal. The traders get the best entry and exit spot
The third is the EMA. This is also appeared in form of a line which move with the price on the chart. When the line is above the price, this indicate the downtrend in the market. When the line is below the price, this indicate the uptrend in the market.
c) What are the different signals observed on the chart?
Above is the chart where we have used the RSI, Bollinger and EMA. The market is rising upward. This mean that the traders should enter into the market. This give the entry signals. But we need to confirm the buy signals using the indicators. When we check the EMA, the price was first below the line which mean that there was downtrend. Then a breakout occur and price started rising upward. This indicate bearish trend has been end and bullish trend has been started. The price started moving above the EMA line which produced the Buy signals.
Now it is time to confirm the buy signals from the second indicator. The RSI is the second indicator which we have been used on the chart. The market was first in the oversold region. Then the breakout occur and the price started rising. The indicator line also started moving upward which indicate the bullish trend. The market started moving toward the overbought region. The traders should buy the coins here to get the high profit.
Then at last, we will analyze the market using the last indicator which is bollinger band. The price was first moving below the middle band, then the breakout occur. The bullish trend started and the price started moving above the middle band which produced the buy signals.
The buy signals has been produced by all the indicators. This mean that the BUY signals is valid here. The traders should buy the coin and should enter into the market to get the high profit.
Conclusion
The Confluence Trading is a way of analyzing the market by combining multiple tools and strategies. When we analyze the market using more than 1 tool, it is known as the confluence trading. The confluence trading is best to minimize lose and maximize the profit. In confluence trading, the traders use multiple indicators so that if one indicator or strategy produce false result, the false signal is filtered out by other indicator and the trader remain safe from making the wrong trading decisions. This is best to maximize the profit. The traders enter and exit from the market using the signals which are produced by the multiple indicators. When 2 or three indicators produced the buy or sell signals, it give more confidence to the trader to take a trading decision.
.png)
.png)
.png)
.png)
.png)
.png)

.png)
.png)
.png)


Hello @farooq2923 , I’m glad you participated in the 6th week Season 5 of the Beginner’s class at the Steemit Crypto Academy. Your grades in this task are as follows:
Observations:
The RSI indicator is not in confluence with the buy signal from the bollinger and the EMA.
Recommendation / Feedback:
Thank you for participating in this homework task.
Thanks prof @reminiscence01
Helo professor @reminiscence01 @steemcurator01 @steemcurator02. Please curate my work