Crypto Trading With Rate of Change(ROC) Indicator- Crypto Academy S4W8 Homework Post for Professor @kouba01

Greetings everyone, I am delighted to once again be part of yet another exciting lesson of our hardworking and noble professor in the person of @kouba01. This week's lesson is focused towards crypto trading with the use of the Rate of Change indicator which seems very interesting. I will therefore move ahead to make my entry post for the various questions asked by our professor.
In your own words, give an explanation of the ROC indicator with an example of how to calculate its value?And comment on the result obtained.
The Rate of Change indicator which we have in the crypto ecosystem is simply an indicator which is gives indications for the percentage change of the price of a crypto assets from the current price to the price of the crypto assets in between a given period of time. That is, this indicator type gives as the change percentage of the prices of various crypto assets. That is from the current price to that of the price of the assets within a specific period of time. Moving further, this operates by simply calculating the change of price percentage within a specific period.
The Rate of Change is an essential indicator that makes it easy for various investors or traders to have a fair idea of the market trend of various crypto assets. The Indicator appears in a form of an oscillating line.
With the help of tis indicator, the trend of the market has been made simply for traders to be able to predict. This includes that of the either bullish or bearish trend. We also have the trend reversal and so on. The ROC indicator has labels of number around it and there is a middle mark with the of point 0 on it. Therefore, we have negative and that of positive sides of it. With a negative side or mark been appearing, there is an indication of a downtrend happening and that of a positive side or mark appearing shows an uptrend happening.
Moving further, with a market structure in which we have the Rate of change indicator going high above the marked 0 point, we have a bullish market trend happening whereas if there is movement of the indicator going below the o mark or point we have a bearish market trend happening.
In addition, we have situations of the market trend been overbought and that of oversold. This trend occurs when we have the marks or point of positive or negative 3% to the of 4% been showing.
As said earlier, the calculation of this indicator type is simply the percentage change of the price of a crypto assets from the current price to that of the price of the assets within a specific period of time.
We have the formula to be given as:
(Current Price of the asset- Price of the asset with a specified period)/Price of the asset within a specified period x 100%
(Cp-Ps)/Ps x 100%
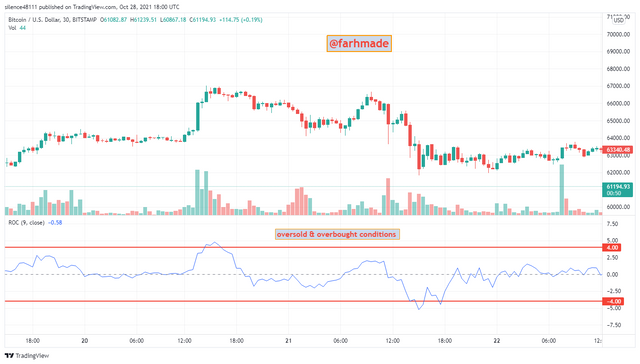
For instance, we have the current price value of Bitcoin to be at $68, 000 and within a period of 30 we had the price to move to that of $64,000. We are to find the Rate of percentage change of it using the ROC indicator.
Cp= $68,000
Ps=$64,000
Period=35
= Rate of change= ($68,000-$64,000)/$64,000 x 100
= ($4,000)/$64,000 x100
= 0.625 x *100
= 6.25%
This implies that, the Rate o change indicator has given us the analysis showing that, the price of the crypto asset which is the Bitcoin made an increase from $64,000 to that of $68,000 within a period of 30 in a percentage of 6.25%.
Demonstrate how to add the indicator to the chart on a platform other than the tradingview, highlighting how to modify the settings of the period(best setting).(screenshot required)
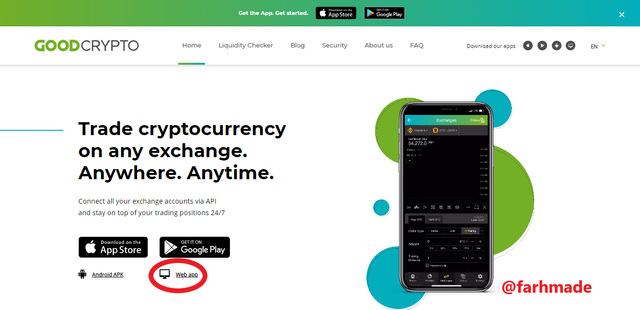
To make an addition of the Rate of Change indicator to a crypto chart and also make a settings of the best to it, I will do the help of this link which takes as to the website of Good crypto where we have various crypto pairs and indicators.
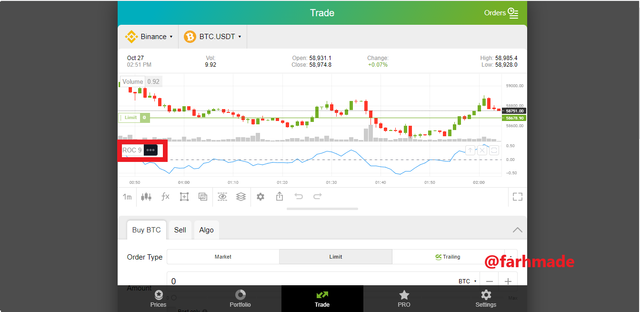
- Make a visit to the Good crypto site to select the type I want to work which is the web version.
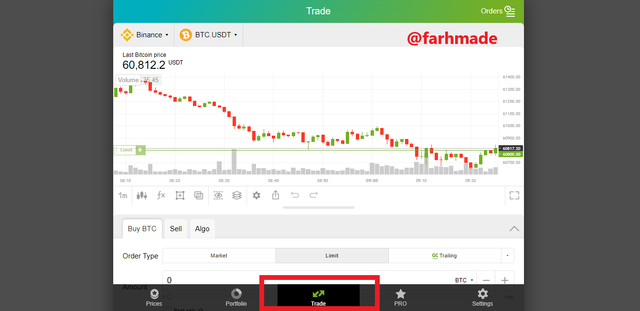
- Click on the Trade which will take us to the trading aspect of the window where we have all the necessary information needed to make good decisions.
- Click on the indicator icon which appears in fx from at the bottom corner for a list of indicator to open so we make a search of the Rate of Change indicator to apply it.
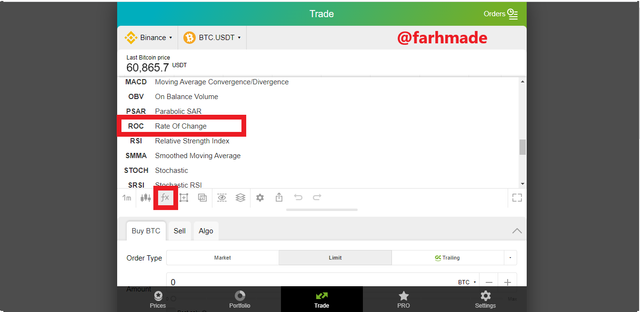
- After been found, Click on it to apply it to the chart of the trading aspect.
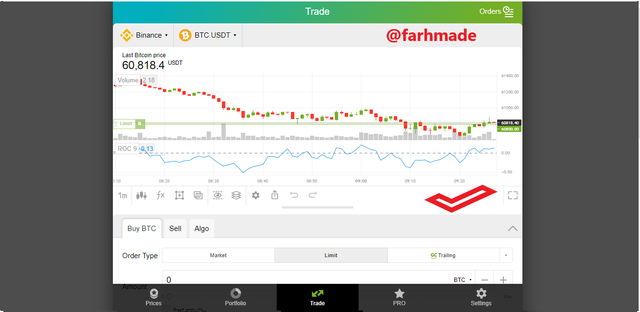
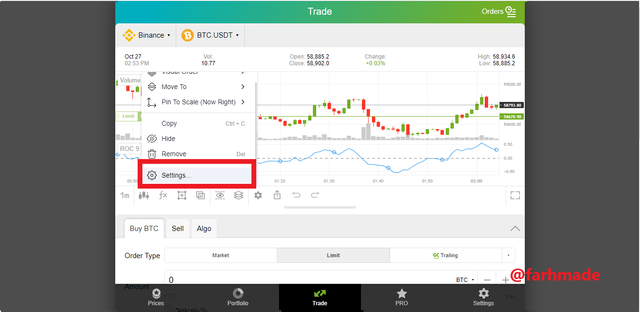
- We will click on the indicator and choose the settings options from the list that appears
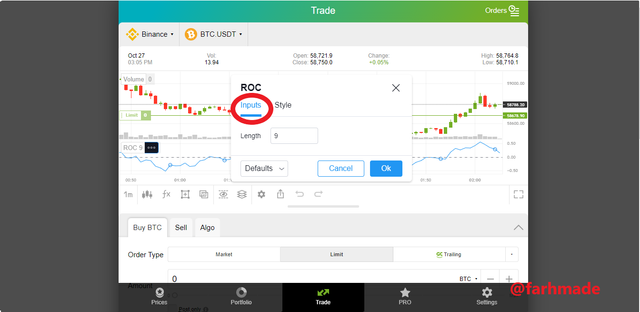
- From the menu that opens, the input aspect makes it possible for the period and length to be modified in order to go in accordance with your preferred trading strategies.
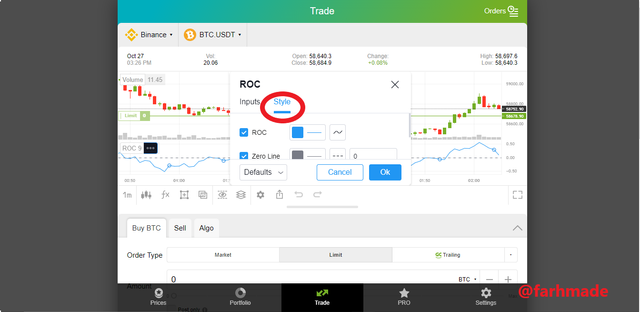
- From the style aspect as well, one can make changes to the color to the indicator to suit the trader.
With regards to the indicator settings of the ROC, the trader makes modifications to the indicator based on the preferences of him or her. But however, the constant settings that was best prescribed for traders was a period been set at 12 or that of 25. Some school of taught has made it know that, depending on the type of trader that will be dealing with the ROC indicator then the modifications of the indicator will be done by him or her.
So in sense that, when the trader is known to be a trader that makes trades within a short period, then he or her uses the a short period settings. But if the trader happens to be a long term type of trader, then he or she uses longer periods. The best indicator settings can also be well predicted if the ROC is used with other great technical indicators so as to produce the best results out.
What is the ROC trend confirmation strategy? And what are the signals that detect a trend reversal? (Screenshot required)
The Trend of the market price value of the crypto assets when using the Rate of Change indicator is very simply. This indicator type as stated already gives as the change a percentage of the price of a crypto asset within a specified period of time. That is, there is an value mark zero in which the indicator moves below and over it to enable the trader or investor determine the trend of the asset.
When the ROC indicator value goes over or above the absolute value of 0 then we have a price increase of the crypto asset and this gives a confirmation of trend been bullish. This shows a increase in percentage price of the crypto asset within a period. On the other hand, when the value of the ROC indicator goes below the 0 mark giving a negative value shows a decrease in the percentage price value of the crypto asset and thereby indicating a bearish trend.
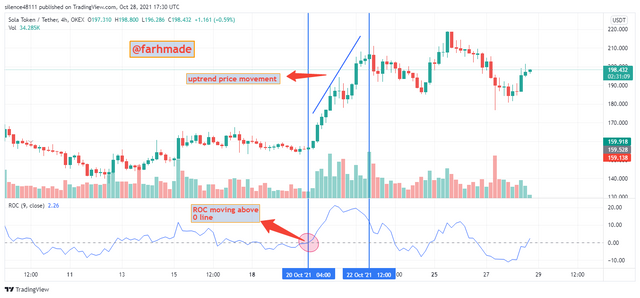
Moving further, the crypto asset is been seen to be in the bullish trend as a result of how clear the ROC indicator goes above the 0 mark and then staying at the point or moving more further. This corresponds with the increment of the price of the assets showing the increment of the percentage change in price as well. Thereby giving as an uptrend of the crypto asset.
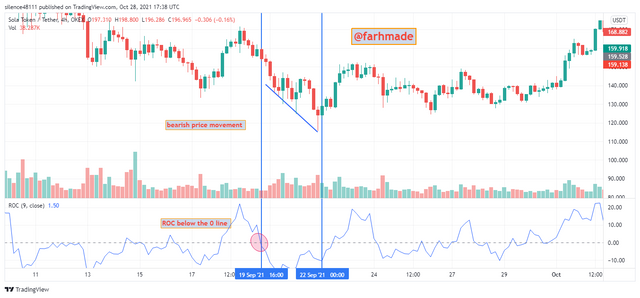
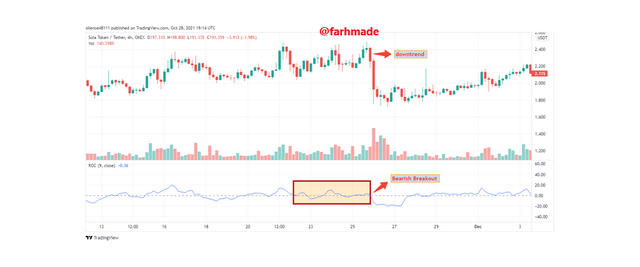
On the other hand, the ROC indicator makes a confirmation of a downtrend movement of the crypto asset by moving below the 0 mark and then going below more. This makes or shows the decrease in the price value of the asset and also a change in percentage of the price value. With this, we will be having more negative values occurring and then making the market to be in a bearish state.
With regards to the Trend reversal, this is been determined through the ROC indicator line moving over and below the mark 0 which is the middle point and also the aspects of the overbought and oversold. The movement of the line below and above gives as the price trend and along side the trend reversal.
What is the indicator’s role in determining buy and sell decicions and identifying signals of overbought and oversold؟(screenshot required)
In order to determine the positions of buy and sell using the ROC indicator, is also very simply done.
This is done by or determined based on the movement of the indicator line either above or below the mark 0 which is the middle point. The ROC indicator gives us the change in percentage price of a crypto asset within a specified period therefore, to get the positions of buy and that of sell, the trend of the price value should also be taken into great consideration before making decisions.
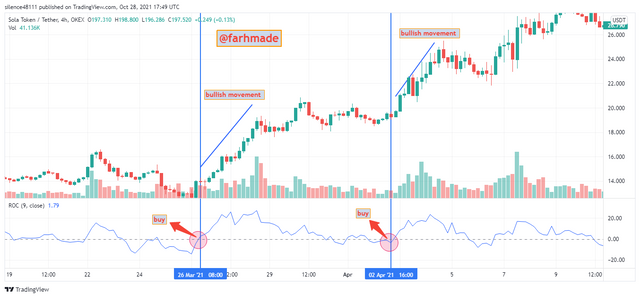
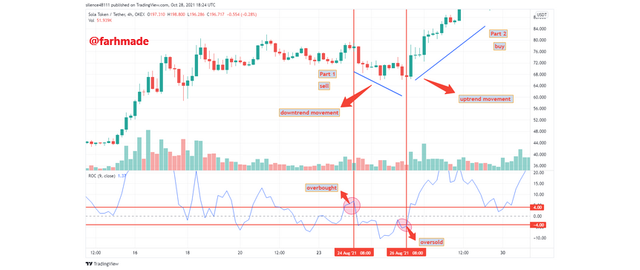
With regards to the buy point, this is determined when the Rate of Change indicator moves above the middle point 0 mark and makes a begins to slightly move back. This is will gives us a good position to make a buy decisions. Therefore, the buy order can then be placed when the trend of the asset moves slightly to a bearish movement when is it an uptrend.
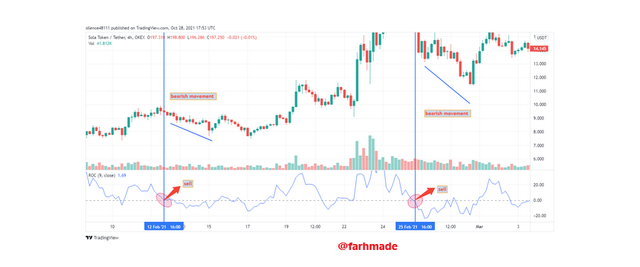
On the other hand, the sell position decision can be made when the Rate of Change indicator line moves below the middle point of the 0 mark and then begins to move down. That is, a sell order can be placed on the crypto asset when the price of the asset in a downtrend begins to a little bit move to an uptrend.
With this aspect of the market trend using the Rate of Change indicator, the best operation of the indicator works when there is a view of a Support and Resistance level seen in the asset movement. That is, this occurs in when there is no trend with the market.
However, some investors have made is known that, the points of positive or negative 3 or that of 4 are been used as the areas to note the oversold and that of overbought signals of the asset.
In a sense that, with the oversold signal signifies a good position to make a purchase and that happens when the rate of change indicator moves above the -4 point. On the other hand, the overbought signal shows when the line of the indicator moves below the positive 4 point and this is a good position o sell. This positions of sell and that of buy all moves along with the price value.
How to trade with divergence between the ROC and the price line? Does this trading strategy produce false signals?(screenshot required)
With regards to divergence as we all know, it is the situation in which we have the price movement of an asset been in a different direction from that of the ROC indicator. That is, the indicator line will be indicating or moving in a different path from that of the asset price. This Trend is mostly used to get the price movement trend as it mostly occurs before the price will to follow.
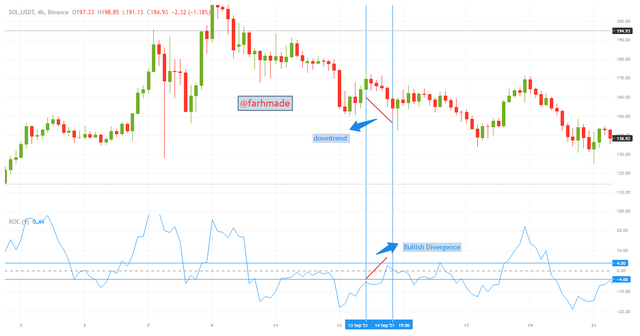
In this aspect, a bullish divergence is simply a situation in which the Rate of Change indicator line shows or displays a trend which is in bullish movement and the price of the crypto asset happens to be in a bearish movement. That is, the bullish signal will be indicated by the line while the price of the asset is in a bearish trend. With tis indication, we have certain investors that can really contain a lot of risk in trading will turn to go into the trade since this is an indication the price will follow up with the line. Whiles those that cannot do or contain a lot of risk turn to relax and wait for the price to follow up the trend movement.
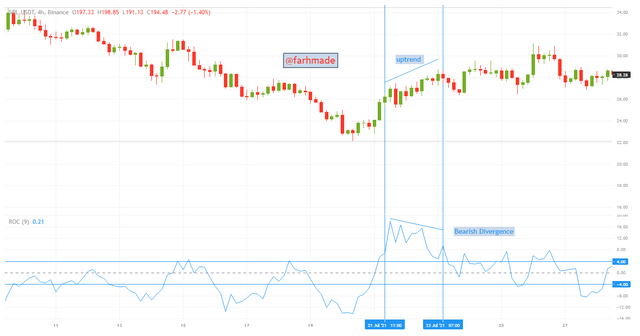
With regards to the Bearish divergence, this simply occurs when the rate of change indicator lie shows or displays a movement which is bearish and the price of the crypto asset is rather in a bullish trend. That is to say, the line of the indicator will be giving signals of a bearish trend and the price of the crypto asset will be in a bullish trend. Once again, traders that can contain a lot of risk do go into trade by making good use of the divergence whiles those that cannot do with a lot of risk wait for the trend to move together.
In the crypto ecosystem, we do not have a 100 percent perfect working indicator. In one way or the other, there will be flaunts as certain points. As same applies to the rate of Change indicator. We have certain wrong readings it do present as we have seen a hand full of them with respect to the divergence.
But with a combination of at least two indicators, we can be on a safer side to get the good results we need in order to make the right decisions.
Let's see the combination of the ROC Indicator and that of the Bollinger Bands Indicator
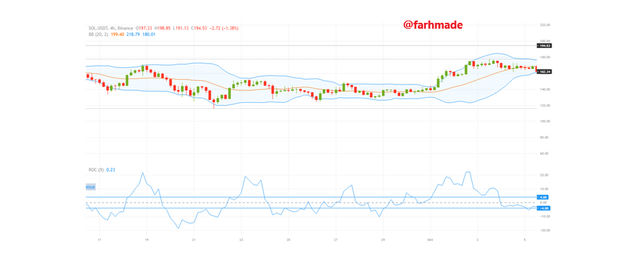
How to Identify and Confirm Breakouts using ROC indicator?(screenshot required)
In dealing with the Rate of Change indicator and breakouts in the crypto market, this is simply the situation where we have the movement of the price of the crypto asset to be moving in a direction which is high above and below the levels of resistance and that of support respectively. That is, the price turn to breakout after moving above the resistance level and that of below the support level. Situations of Bearish and that of Bullish do occur as well as I will explore them below.
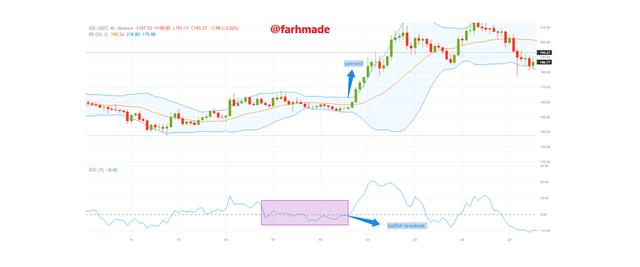
With the ROC indicator, we have the line to either above or below the middle point which is the 0 mark. When a breakout occurs, we have the ROC indicator making a confirmation of it by a very fast movement across the middle point.
For a Bullish breakout, the line to move very fast above the middle point which is marked 0 and that of Bearish breakout occurs when the line moves very fast below the line.
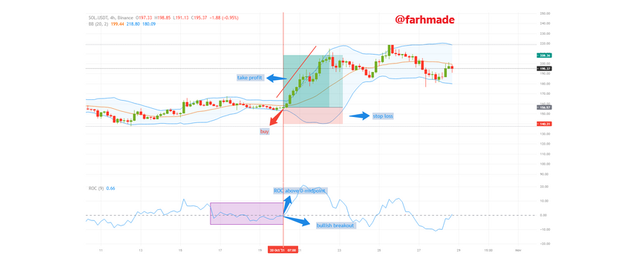
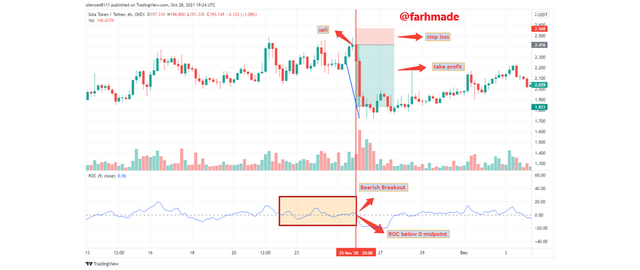
Review the chart of any crypto pair and present the various signals giving by ROC trading strategy. (Screenshot required)
With this aspect, A buy and sell entry or positions will be set with the help of the Rate of Change indicator and that of the Bollinger Bands. With the rate of change indicator, we know the buy position is when we have the indicator line moving above the middle point which is the mark 0 whereas the sell point is when we have the line moving below the middle point mark 0.
In this aspect, we have the position of buy been place as a result of readings of the Bollinger bands and that of the rate of change indicator. This as a result of the indicator line moving above the middle point and that of the Bollinger Bands squeezing together indicating a buy position. Both indicators were set to the default settings and the chart is that of SOL/USDT crypto pair.
In this aspect, I made good use of the crypto pair of the Solana token/Tether in setting my order. The ROC indicator was used alone this time around with default settings.
The position of sell was set as a result of the Rate of Change indicator line moving below the middle point mark 0. This shows a good position to sell thereby making me place my order for the sell. This was done with other clarifications needed and indications of the indictor.
This week lesson has been a great one and I really enjoyed taking part in it. The Rate of Change indicator is another great tool in the crypto ecosystem that helps in giving great signals and positions for traders to make the right decisions along side get profits when making trades. However, making an addition to other indicators we have in the crypto world will be of great help to us since the two together will predict or indicate great results to traders.
I am grateful to our noble professor in the person of @kouba01 for this wonderful lesson and I wish him well in his work.
All screenshots where taken from the Trading View and the Good Crypto
Hi @farhmade
Thanks for participating in the Steemit Crypto Academy
Feedback
Total| 5/10
This is average content. You need to improve on the clarity of your explanations. I found trouble in understanding your work. Kindly improve on the quality of work.
I have found many typing errors in your work. Always check your work to rectify such errors before submitting it for review. Your article lacked an in-depth analysis into information regarding trading using the Rate of Change indicator.
Lastly, you are not eligible for an extra upvote for the #club5050 initiative because in the last 7days you transfered 6 sbds and also cashed out 54 steem which is greater than the total of about 95steem that you have powered in the past 7days. To be eligible you have to power up at least half or more than what you cash out in the period of 7days.
Please @yohan2on your way if grading is very poor. You haven’t read through the work thoroughly with all due respect. Our noble professor @kouba01 reviews it much better. I am sorry I am not happy with your review. You did that same last week and you have done same. I don’t know if you have a problem with me.
Thank you very much I wish you well in your work.