BITCOIN Finding a Little Love at the Lower Trend Line Support
Bitcoin seems to have bounced up after hitting both lower trend line supports and the price level $4,270 which I stated earlier should be support (for a small bounce).
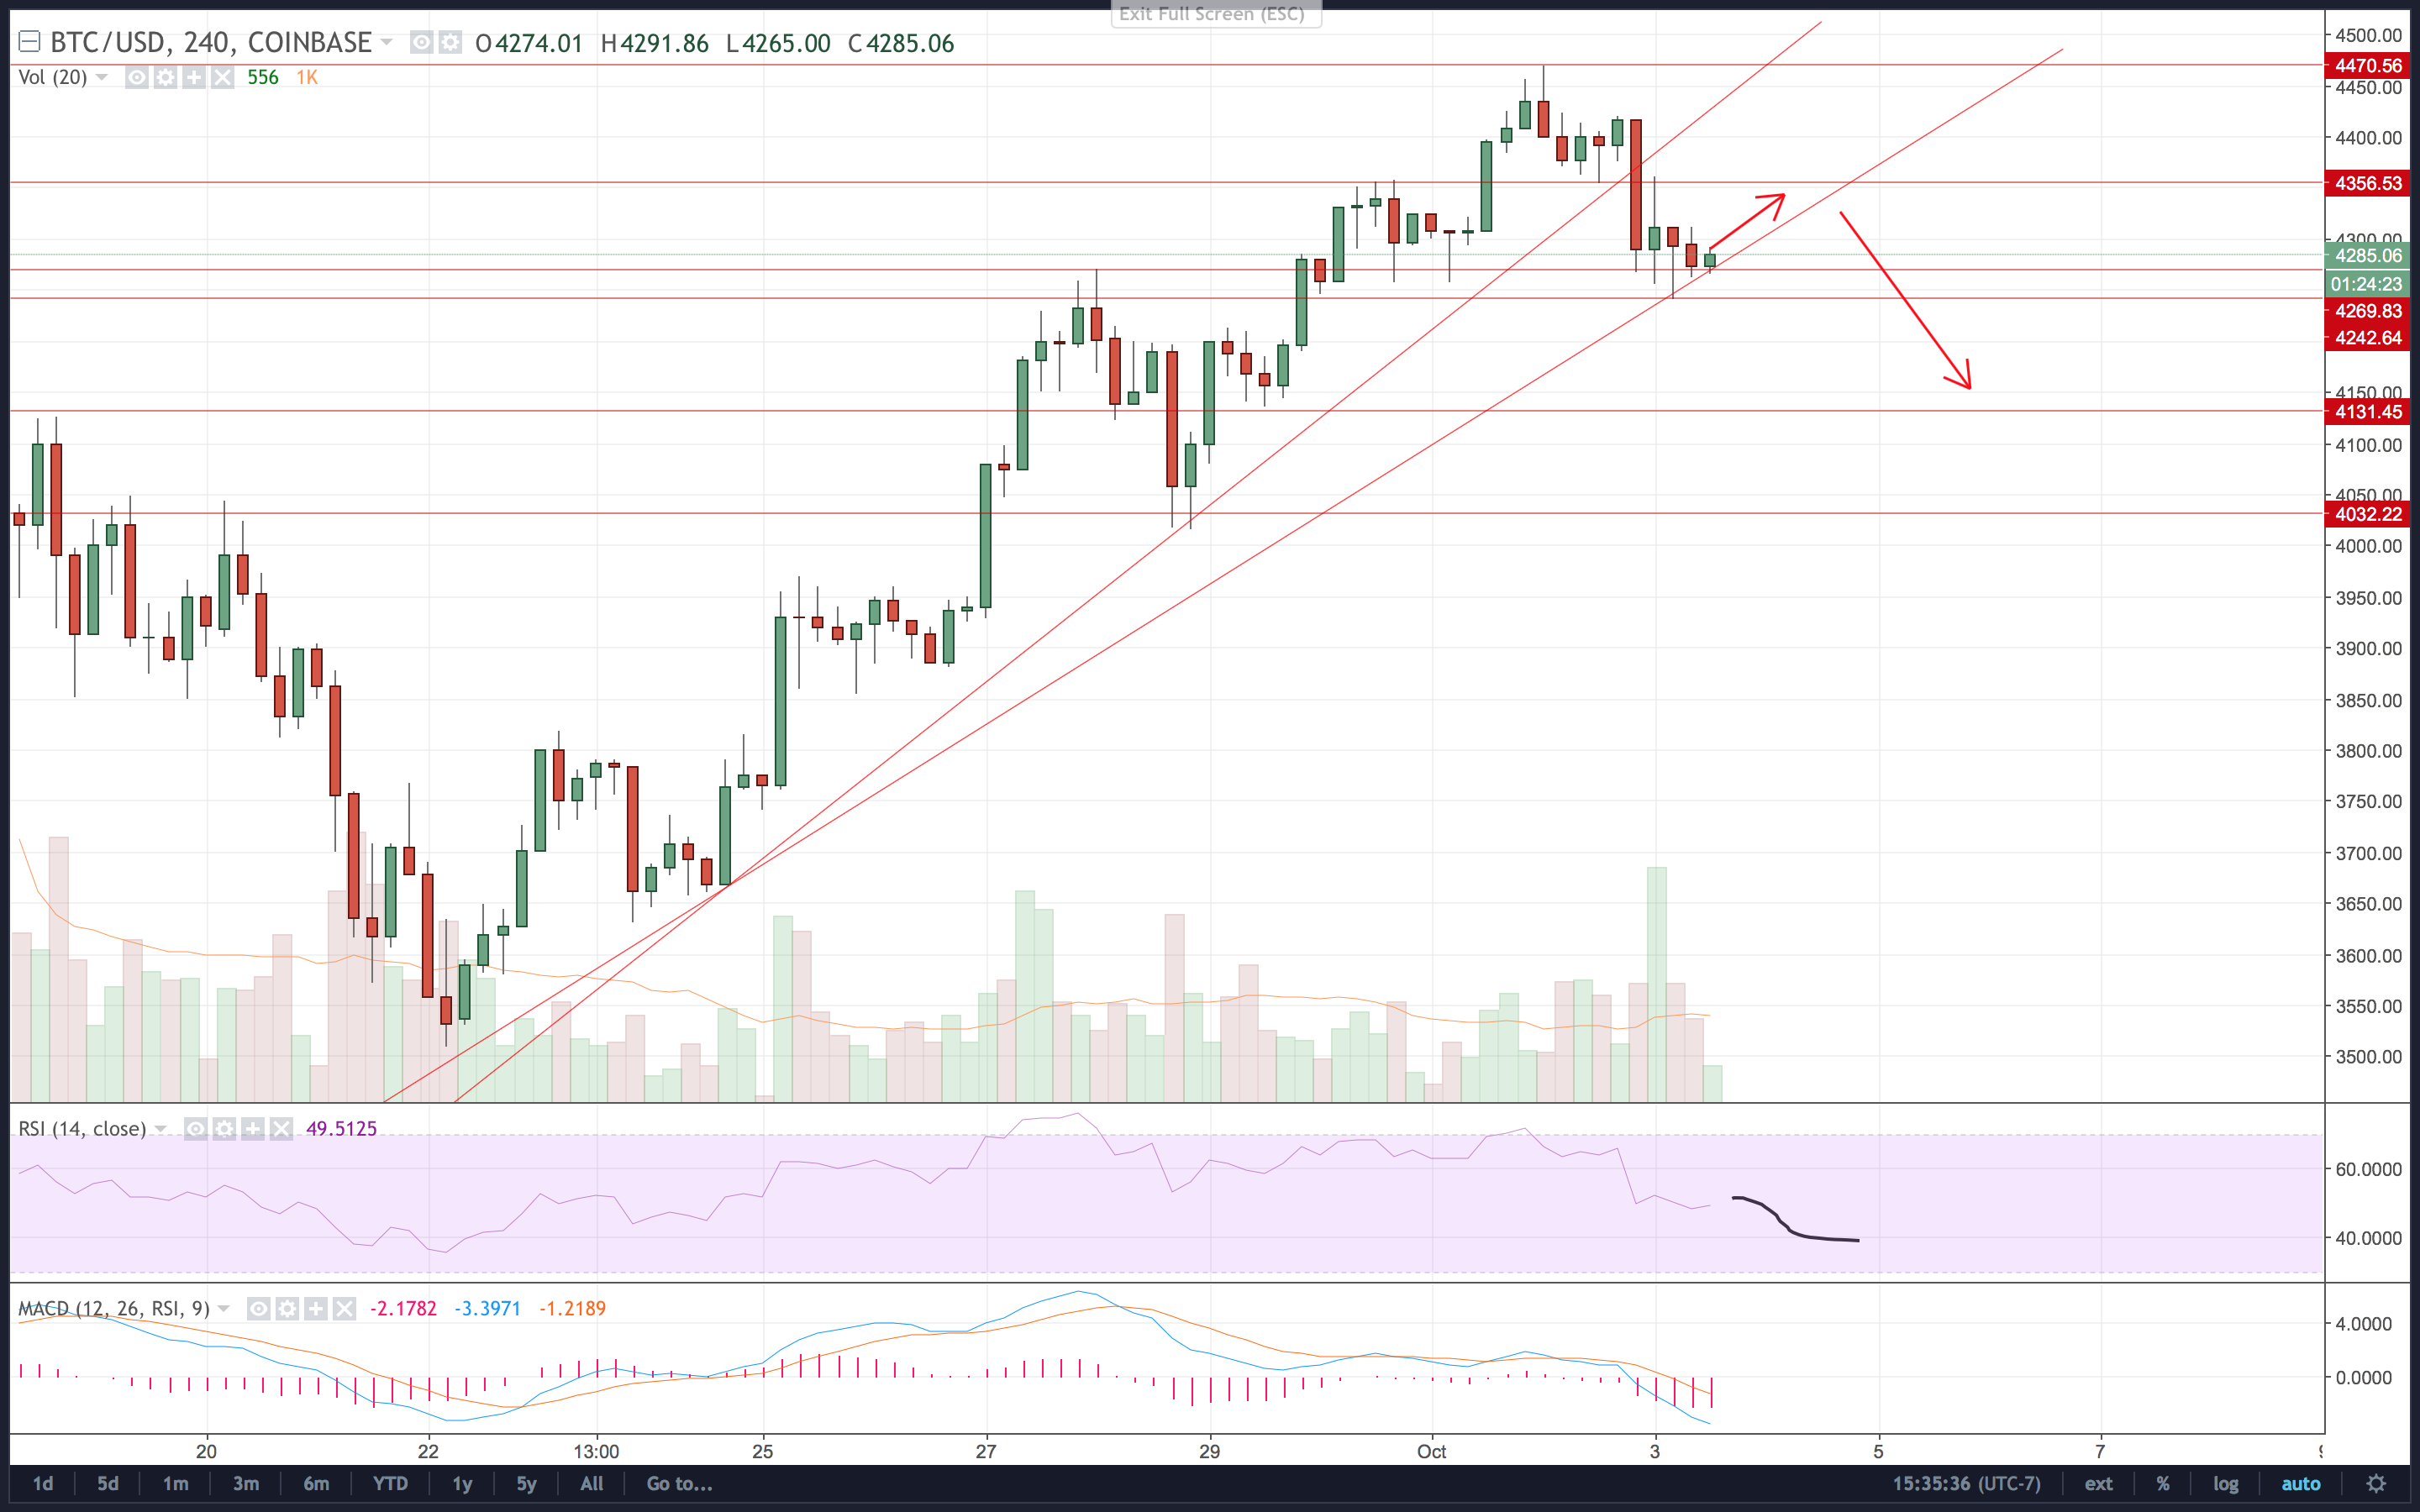
The test now is if BTC can find enough support and bull momentum to head up and break $4,356. If this happens, another retest of $4,470 is likely. However, I'm not super confident in the momentum now to break $4,356.
Indicators are heading down showing increasing bearish pressure which would need to be heavily fought off by the bulls. I don't think with general normal news that this is enough for this to happen.
The largest bull candle in days formed a spinning top doji that had a longer upper wick than a hammer handle. This candle came from a huge oversold dump and was not confirmed by the bulls. This is very much a bad sign, as was proven despite buying pressure in the $4,270 zone.
BTC formed a lower low from the way up, signaling weakness and trend change near. Once BTC falls below the lower trend line, its strength will be tremendously reduced.
$4,356 and $4,470 are very much the heavy resistance levels, with $4,242 and $4,131 as lower supports. Breaks of those would see a retest of the $4,040 support and $4,000 psychological.
It is recommended that now is NOT the time to open long positions. Stay safe!
I like your analysis. I read more about spinning top candles, learned something thanks to you.
What do you think is the lowest support line if BTC were to start a major downtrend?
Thanks! The main ones for support are $4,000 psychological, $3,510, and then $3,000. I'm fairly confident we'll see tests of these levels here before too long.