What do the different colored
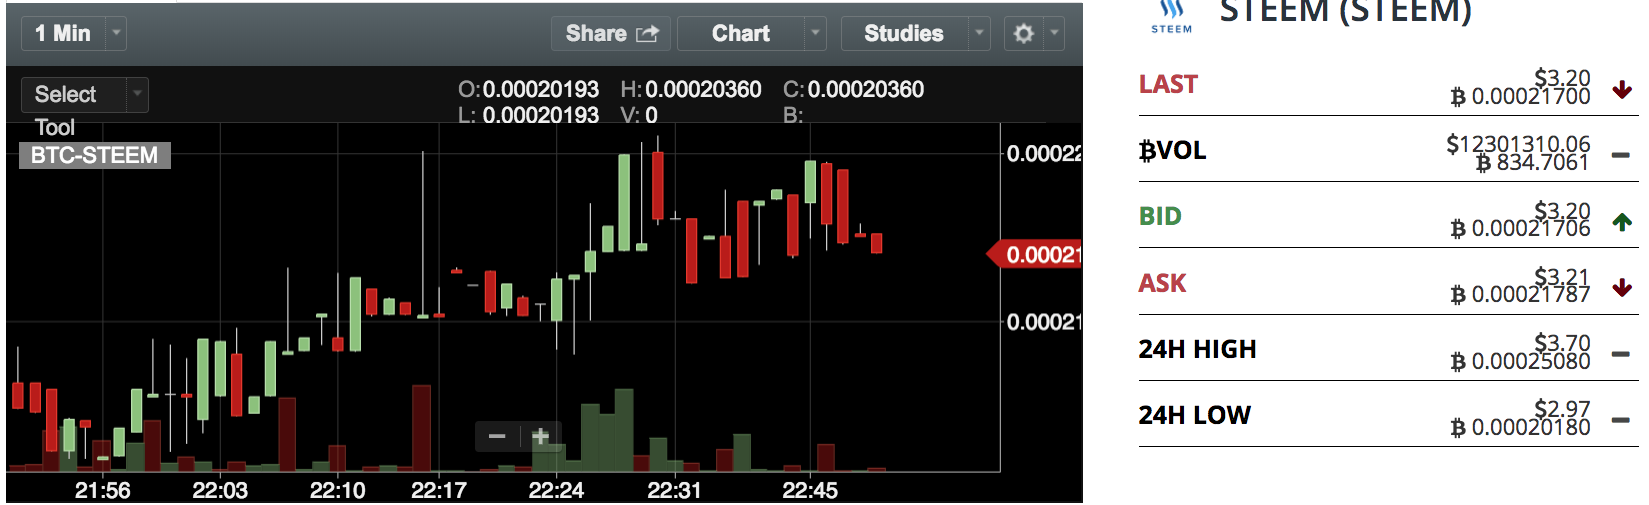
candlesticks mean?
.....................................................................................................................................................................
Beats the hell out of me.
the site says.
- Candlestick charts have been used in Western trading for many years and are a very popular method of plotting the price action of a given security over time. A typical candlestick chart is composed of a series of bars, known as candles, which vary in height and color. As you can see from the figure below, the color of each candle depends on the price action of the security for the given day. An unfilled candle, shown on the left, is created when the opening price is lower than the security's closing price. Remember that each bar can represent a minute, day, week, or even month, but the chosen time frame does not influence the color of the candle because a hollow bar will always be created when the close is higher than the open. This type of candle shows that buyers were in control of the security because the price was able to rise over the period, but this does not provide enough information to predict what will happen next.
clear as mud.
Note: the damn site is full of pop-ups. Makes it very damn difficult to concentrate.
A word to the wise is sufficient.
Investopedia.com has answered a lot of stock/chart related questions for me. Very helpful tool for any investor/trader