Bitcoin Electricity Consumption Index ⚡️ #club100
Since the exact electricity consumption of Bitcoin cannot be determined, various indices have been created to estimate this consumption. Cambridge University has created one of these indexes. I will tell you about The Cambridge Bitcoin Electricity Consumption Index (CBECI).
The index provides a hypothetical range consisting of a hypothetical lower bound and a hypothetical upper bound estimate.
When estimating the lower bound, it is assumed that all miners always use the most energy-efficient equipment available on the market. That is, it is based on the best-case assumption. Thus, Theoretical Min. Total Electricity Consumption is determined.
When estimating the upper bound, it is assumed that all miners always use the least energy-efficient hardware available in the market. These assumptions are made as long as it is electrically profitable to operate the equipment. That is, it is based on the worst-case assumption. So Theoretical Max. Total Electricity Consumption is determined.
Due to the design of this model, the upper bound is highly sensitive to changes in bitcoin price. Therefore the upper bound can deviate significantly.
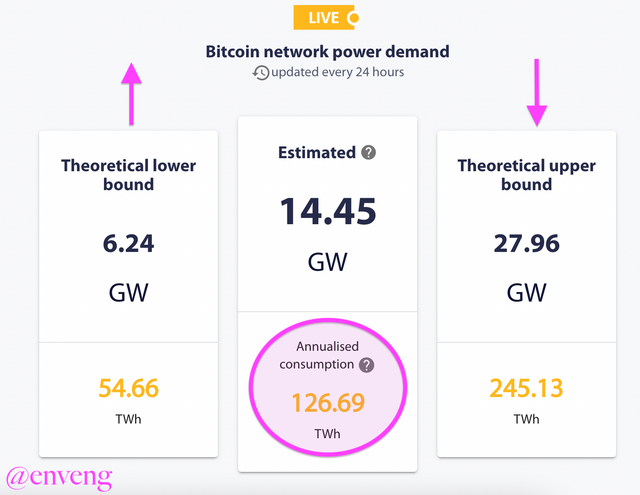
It is based on the more realistic assumption that miners use profitable hardware instead of a single model for the best prediction✨
I will talk about the CBECI landing page. There are two numbers for each estimation type on this page.
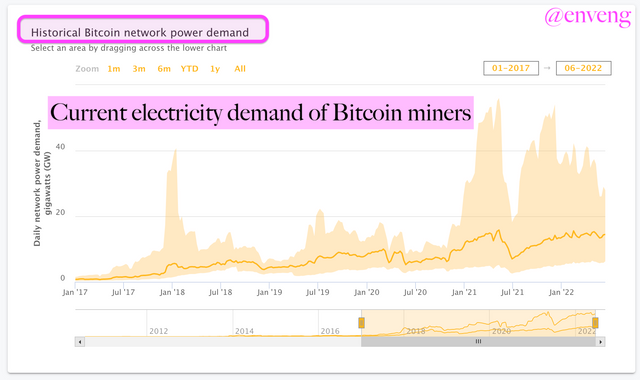
- The first number represents the Total Electrical Power (GW) consumed by the Bitcoin network. This number, which describes the current electricity demand of Bitcoin miners, is updated once a day👇
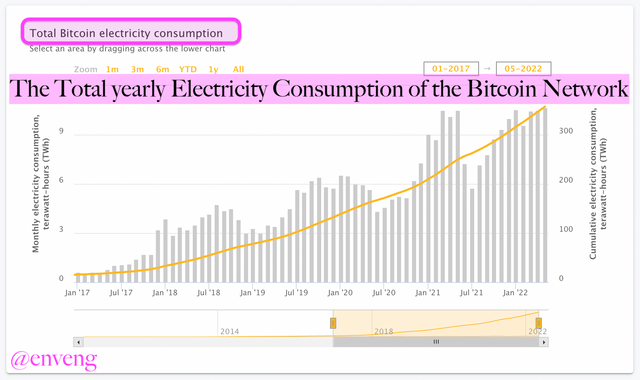
- The second number represents the Total Annual Electricity Consumption (TWh) of the Bitcoin network. It is an annual measure and assumes continuous power usage at the rate specified above energy demand for one year. They applied a 7-day moving average to the resulting data point to make the resulting value less dependent on short-term hashrate fluctuations. Thus, they aimed to make the output value more suitable for comparisons with alternative electricity uses⚡️👇
Monthly consumption: figures The sum of daily consumption figures of Bitcoin's network power demand, assuming constant power usage for 24 hours.
The Electricity Cost
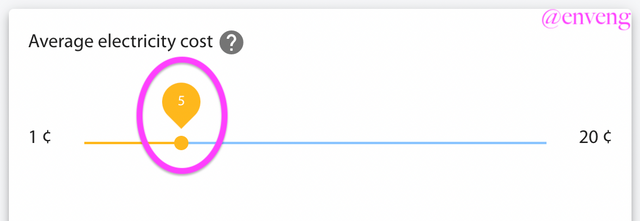
This parameter is very important in determining the economic life of mining equipment. The model assumes a fixed average electricity price of $0.05 USD per kWh. You can set the parameter from this link to see how the model responds.
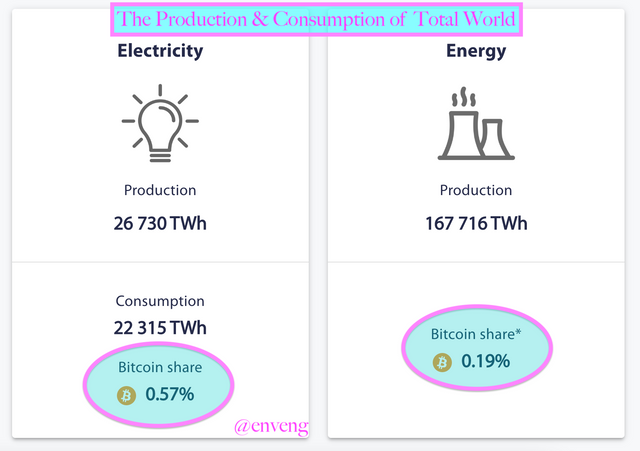
The share of Bitcoin in the world's total annual electricity generation and consumption is shown. The amount of electricity consumed for Bitcoin mining is equal to 0.57% of the electricity used in the world on an annual basis.
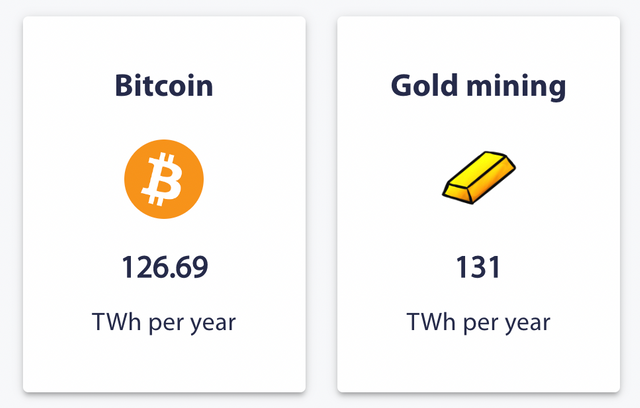
Bitcoin is most closely compared to Gold. They are very close in terms of energy density. Just like Bitcoin, there are academic studies comparing other cryptocurrencies with gold.
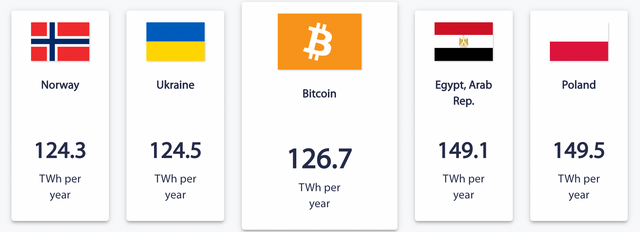
Bitcoin's country comparisons are among the most common and notable comparisons. It is used specifically to support concerns about Bitcoin's electricity consumption.
According to the available data, the electricity consumption of Bitcoin is higher than the annual electricity consumption of Norway and Ukraine.
Fun Facts: Cambridge University has added a fun part to their studies.
They reported that the amount of electricity consumed by the Bitcoin network in a year could meet the total electricity need of Cambridge University for 911 years 😮 I think it is one of the most striking examples of the electricity consumption of the network.
They calculated that the amount of electricity the Bitcoin network consumes in a year could power all the kettles used to boil water in the UK for 28 years 😄

The place of Proof of Work in energy consumption continues to be one of its most negative aspects. I hope my content will attract your attention and interest in the context of Bitcoin's energy consumption⚡️
All screenshots are taken from this website.
Thank you 🤗
Good information from you. Pls share like those as much as possible to us.
Take care.
Thank you so much 😊🌼
Thank you 🌸