Crypto Academy / Season 3 / Week 8 - Homework Post for professor @cryptokraze | Trading Sharkfin Pattern
.png)
Another week and another great lecture from @cryptokraze and this week he taught about trading sharkfin patterns , so lets go into how i answered his questions

1 - What is your understanding of Sharkfin Patterns. Give Examples (Clear Charts Needed)
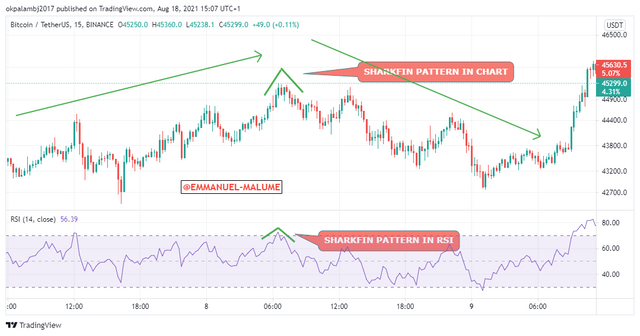
We often see the market undergo a quick reversal when moving in one direction and then changing to another. There is a pattern formed in the market when these reversals occur and these patterns are known as sharkfin patterns. These patterns are in V shape which is either straight or inverted depending on the initial direction of the market.
If the market was moving upward initially, it forms an inverted V shape sharkfin pattern resulting in a change to a downtrend. If the market initially moves downwards, we see a normal V sharkfin pattern before the price starts moving up. Actually, the formation of these patterns is actually a form of manipulation where the market seems to go in the normal direction before the price reverses in another direction. In other words, sharkfin patterns are reversal patterns
For the uptrend to downtrend :
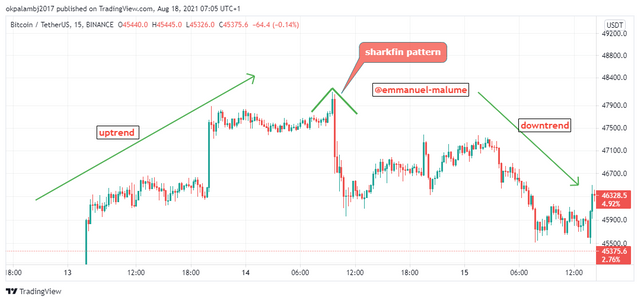
We can see a good inverted V sharkfin pattern formed in the btcusdt chart resulting in a change of market direction from an uptrend to a quick downtrend and we can also see how the market was manipulated there taking out those buyers.
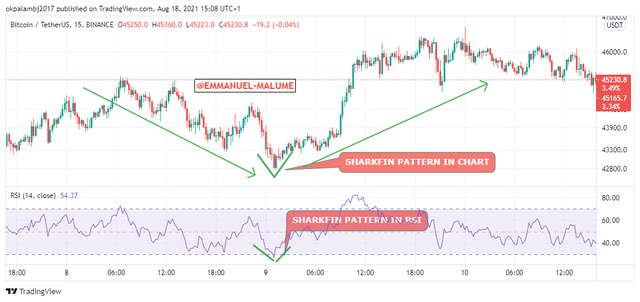
For a downtrend to an uptrend ;
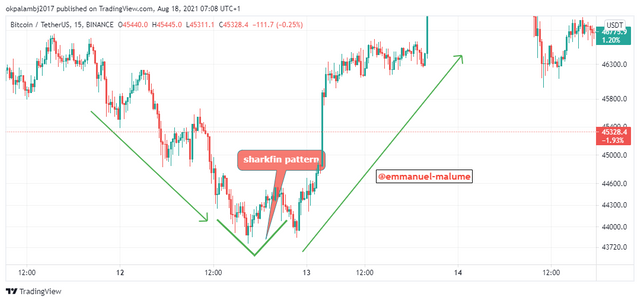
In another part of the btcusdt chart, we saw price form a V sharkfin pattern during a downtrend and we saw price move up from there
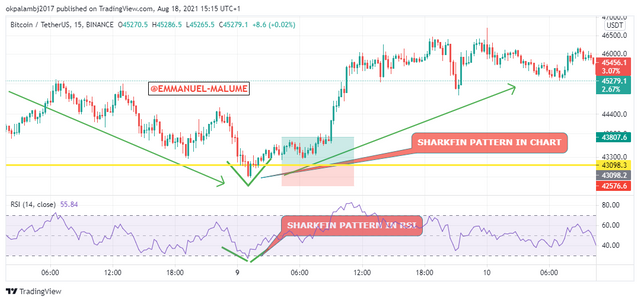
2 - Implement RSI indicator to spot sharkfin patterns. (Clear Charts Needed)
Rsi is a very good indicator for identifying market reversal and we can use this indicator to confirm sharkfin patterns which are good reversal patterns. We can apply RSI for confirming these patterns by using their overbought and oversold regions for this purpose.
steps
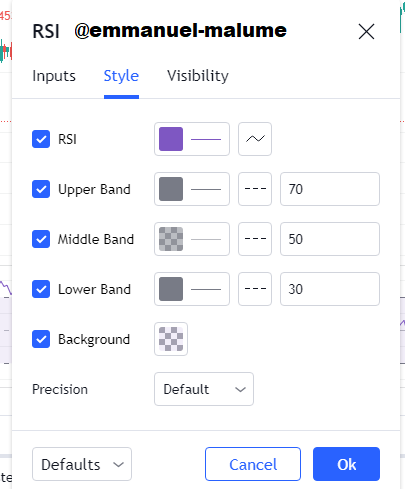
1.First of all, we need to set up the RSI indicator with the length 14 and the band region should be 30 and 70
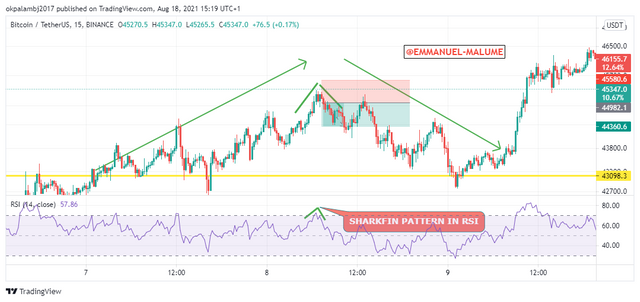
2.Then for different market conditions we look at the below
UPTREND TO DOWNTREND
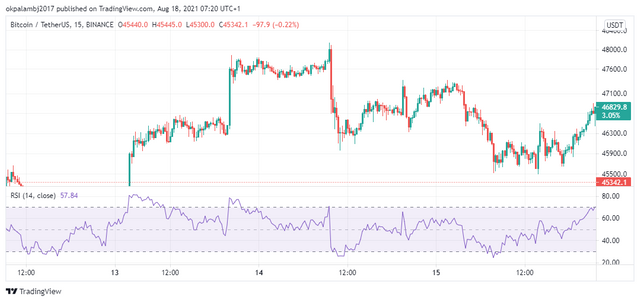
1.We wait for the indicator to enter the 70-100 region which is the overbought zone and when we see the formation of the sharkfin pattern in this zone by the RSI and we also wait for the formation of the sharkfin pattern in the chart too. we can see an example below
DOWNTREND TO UPTREND
1.We wait for the market to enter the oversold region which is the 0-30 zone. When we see the indicator in this region and we see the indicator form a sharkfin pattern and we see a sharkfin pattern in a downtrend market, we can confirm these patterns using the indicator
3 - Write the trade entry and exit criteria to trade sharkfin pattern (Clear Charts Needed)
Two important components are used for trading these patterns: the sharkfin pattern itself and the rsi indicator set at default. For uptrend and downtrend, the criteria differs a lot
FROM DOWNTREND TO UPTREND
FOR ENTRY
1.First of all the V pattern should form first with the price suddenly reacting from a downtrend direction
2.The we should see the RSI indicator in the oversold region of 0-30
3.We should also see the indicator form a v pattern too in this region and start moving up from there
4.When we see indicators exiting the oversold region we take our entry
For EXIT
One needs to protect both his capital and profits so we need to set stop loss and take profits
STOP LOSS
We set the stop loss below the swing low formed V pattern so that if the trade goes against us we don't get liquidated
TAKE PROFIT
We should target a 1:1 R: R in setting our take profit for good exit points in the market and so we don't end up returning all our profits to the market. At the predicted take profits we can either close the trades or take some profits off them then we can trail stop loss or break even the trade
FROM UPTREND TO DOWNTREND
ENTRY
1.We wait for the price to form a very neat reversed V pattern on the charts
2.We now wait for the RSI indicator to enter the overbought region of 70-100
3.We await for the indicator itself should now form a V pattern too
4.We wait to see the indicator exiting this zone then we take our entries
EXIT
We also need our stop losses and take profits in this type of market
STOP LOSS
We set our stop loss above the most recent swing high that formed the v pattern
TAKE PROFIT
We set our take profit at a 1:1 R: R where we either exit the market with the profit or we take some profits off the market and then we can put a trailing stop loss or break even
4 - Place at least 2 trades based on sharkfin pattern strategy (Need to actually place trades in demo account along with Clear Charts)
In this btcusdt chart below in the 5 min time frame, we saw price form a perfect V sharkfin pattern in the chart followed by another in the rsi indicator so we took the buy entry and it was also leaving the oversold region too in the indicator
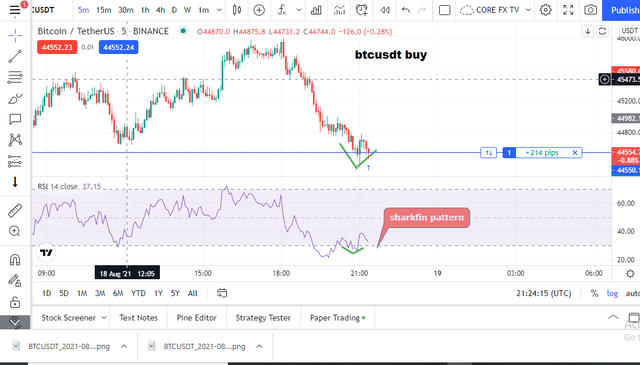
Closed the order later with profits as seen below

SXPUSDT TRADE
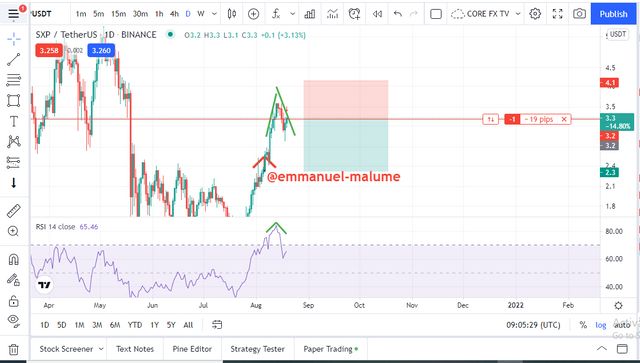
In the daily time frame above, we can see a good inverted v sharkfin pattern with price moving up and then reacting suddenly and moving downwards and we can see price in the RSI indicator was in the overbought zone and also formed a good inverted v sharkfin pattern and I took a sell trade putting stop loss above inverted v pattern and then targeting a take profit of 1:2

conclusion
The sharkfin pattern is a really good pattern for taking market reversals although it is not perfect on its own, it can in combination with the RSI indicator we can confirm the pattern and use it to take entries in trading while putting our stop loss either above inverted V pattern or below for normal v pattern. It is also good to apply proper risk management in trading using a minimum of 1:1 R: R or one can use more but only risk an amount you are willing to lose. Thank you @cryptokraze.