Hashrate and accumulation levels are increasing, what does this mean for BTC?
Bitcoin seems to maintain a calm posture amidst the turbulent macroeconomic environment, consolidating its price roughly between the $18500 and $20200 since the middle of last month, a rare period of consolidation for such a volatile market; however two On-Chain metrics have soared, its hashrate and accumulation level. What could it mean for BTC that despite the price declines, these two metrics are improving?

Image edited in powerpoint, original from pexels.com
Hashrate reached a new high
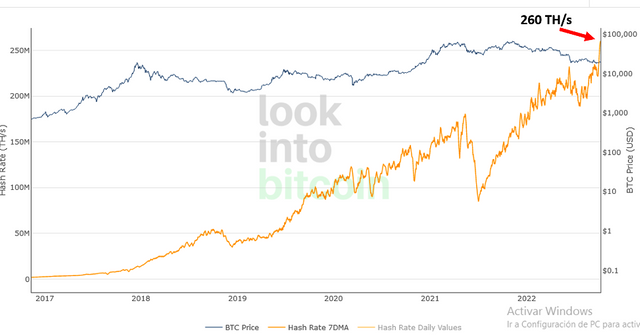
As we can see in the graph below, last October 07, the Bitcoin Hashrate recorded a new ATH of 260 TH/s. And despite the price drop, we can see that since July this indicator has been on the rise.

Bitcoin Hashrate. Source: lookintobitcoin.com.
Recall that the hashrate is a very important concept in the world of cryptocurrencies, since its value is associated with the amount of computational operations that the network of miners is able to perform, that is, it is the processing power of the Bitcoin network, in this sense it is a very important indicator of the health of the network.
But what could this increase in hashrate be due to if we have not observed a significant increase in the price of BTC? Perhaps the answer can be seen in the Hash Ribbon chart.
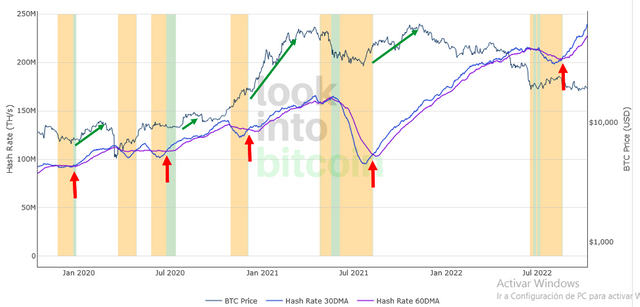
It is worth remembering that this indicator tries to identify periods in which miners have difficulties to trade profitably and may capitulate, the indicator uses two simple moving averages of the Hashrate, a 30-day and a 60-day moving average, indicating that the miners' capitulation is over when the 30-day moving average line crosses back above the 60-day moving average.

Hash Ribbon chart. Source: lookintobitcoin.com.
And as we can see in the chart above, the 30-day moving average line surpassed the slower line at the end of August, this represents a good opportunity to buy, and we can observe it in the past, since as we can see in the chart, this average crossing has preceded a price increase, but as currently this has not been the case, then this behavior perhaps corresponds to more efficient mining platforms or a greater number of them in operation.
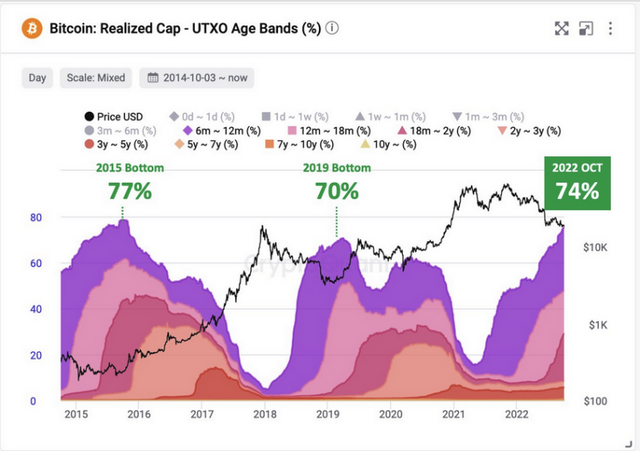
Another metric that has reached a peak is the level of accumulation, according to a graph recently shown by the CEO of CryptoQuant, with which he has made reference that Bitcoin aged between 6 and 12 months reached to have in October 74% of the realized capitalization, something similar seen in the 2015 and 2019 funds.

Realized Cap – UTXO Age Bands. Source: Ki Young Ju twitter.
And while overall we see these mining and accumulation metrics improving, which has previously preceded a bullish rally, we see that the price has yet to react, so a bullish push will ultimately depend on the macroeconomic conditions surrounding the market.
Well friends, we can only stay tuned in case these metrics are suggesting that Bitcoin is getting ready for a bullish momentum. Hope you liked the information, see you next time!
