Fractals in trading
Traders always seek to know and integrate new techniques in their market analysis, in order to gain an advantage, identifying the formation of a trend or an early signal of a reversal of the current trend, in this sense, we will explore an interesting way to recognize price patterns on the charts, this is thanks to the help of the Fractal Indicator.
Edited image, original from pixbay.com
Basically a fractal is a geometric object in which we can observe that the same pattern is repeated, the term Fractal is derived from the Latin Fractus which means fractured, since in a fractal object we can see that the elements appear with the same pattern, although they can be presented at different scale and with another orientation. In nature we can find fractal objects very often, branches of trees, plants, snowflakes among others.

repetitive patterns can be found in snail shells and in many plants. Source: public domain images
How does this apply to cryptocurrency markets?
Regarding the behavior of markets, we can find some kind of analogy with fractal objects. As we know, cryptocurrency markets are characterized by their high volatility, however we can find in it some patterns that are repeated with certain frequency and that are the basis of our analysis, such as when we establish a support or resistance, since it is an area where the price bounces frequently or finds opposition, this often marks a pattern that allows us to infer the market trend.
So, the use of fractals in trading refers to the use of geometric patterns in technical analysis, using repetitive patterns observed in the charts. According to the theory of this indicator proposed by Bill William states that, in a candlestick chart, these patterns consist of five consecutive bars ordered in a predefined way, being the central bar higher or lower than the two preceding candlesticks and the two following ones, being able to find two types of fractal patterns:
Bullish fractal: we speak of a bullish fractal when in the five candlestick pattern we observe that the central candlestick has a lower low and high than the candlesticks to the sides, and the candlesticks to the sides have higher lows and highs with respect to the contiguous one. In this case this pattern warns us of a possible uptrend.
Bearish fractal: to identify a bearish fractal we need to observe that the five candlestick formation is formed by a central candlestick that has a higher minimum and maximum than the candlesticks to the sides, and the candlesticks to the sides have lower minimums and maximums with respect to the contiguous one. And in this case, this pattern helps us to predict a possible bearish reversal.
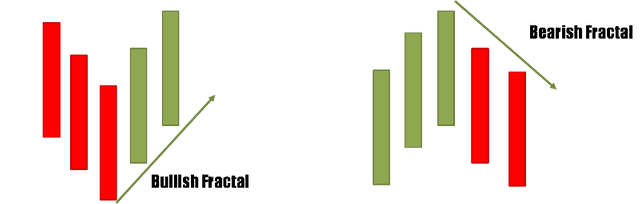
Fractal patterns. Image prepared in Powerpoint.
Williams Fractal Indicator
This is one of the indicators related to fractals for market analysis developed by Bill Williams, and it is one of the most widely used fractal-based indicators.
And the truth is that the signals given by this indicator are very easy to interpret, basically the indicator is composed of triangles located above or below the candles and whose position indicates the location of a fractal. By adding this indicator on the chart we will observe green triangles pointing upwards, which signal a bearish fractal and therefore an opportunity to enter the market with a sale, or we can observe a red triangle pointing downwards, which signal a bearish fractal and therefore an opportunity to buy the asset.
In the following image we can see the triangles that indicate the location of a fractal on the chart.
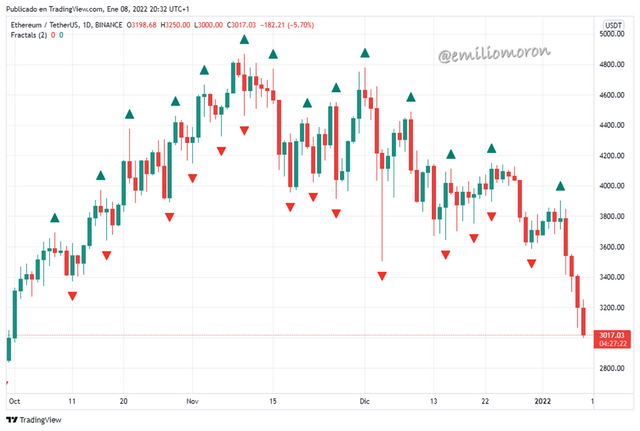
Screenshot taken from Tradingview.com.
As we can see, many fractals are indicated on the chart, basically all the formations that comply with the five candlestick structure are indicated, so we should pay more attention to those signals that are accompanied by the corresponding change of trend, or use other indicators that help us to improve the efficiency of the Williams Fractal Indicator.
To perform trading operations we can use the Williams Fractal Indicator with other indicators that help us to confirm the signals, for example, looking for options with which to make a purchase, I found an opportunity in the price chart of the pair LUNA/USDT; in this chart I managed to identify the formation of a bullish fractal, indicated with the red triangle, where the characteristic formation of the five candles is clearly observed. In addition, I find that prices are moving above the EMA and the RSI is oscillating in the overbought zone, two indicators that I like to use, this suggests to me that the newly established uptrend could continue.
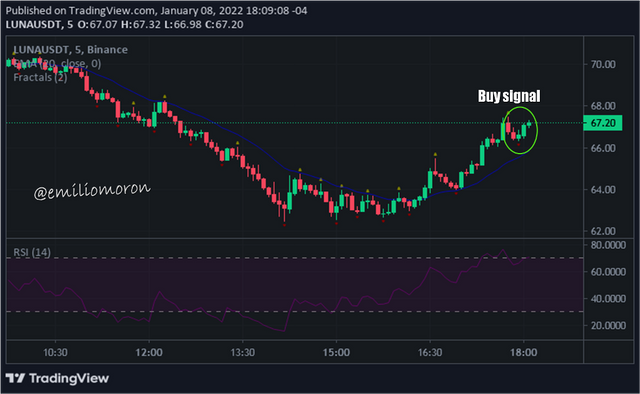
Screenshot taken from the Binance platform.
In general we can say that fractals, whose concept is derived from the repetition of patterns, a fact that is very common in nature, can also be found in the markets, and take advantage of this condition to carry out strategies that allow us to obtain profits.
Thanks for coming by to read friends, I hope you liked the information. See you next time.

Greetings @emiliomoron thanks for the valuable delivery, knowing the patterns that are generated in the market is important to understand the price action. At this point fractals as repetitive patterns of price action can become an excellent tool to speculate in the market.
Thank you for the delivery...
Hello friend @madridbg, it is really important to recognize patterns in the market to be able to predict future trends and to be able to trade according to this estimation, and in that fractals can be a great support tool.