Trading With Chaikin Money Flow (CMF) Volume Indicator - Crypto Academy / S4W6 - Homework Post for [@kouba01]
Helle lovely people around thr globe, hope you are all doing well. Today's homework post is for professor @kouba01 añd we shall discuss about Chaikin Money Flow indicator.

In your own words, give a simplified explanation of the CMF indicator with an example of how to calculate its value?
Chaikin Money Flow indicator Is a volume-weighted average of accumulation and distribution over a specified period ( 21 or 20) and is used to measure buying and selling pressure on the basis of volume of cash flow. Buying and selling pressure Is the driving force behind generation of trend in market and trading opportunities thereby. CMF is an oscillator that fluctuates around a mean line or zero line and the extremes being -1 to +1. Any movement of oscillator above mean line is positive and movement below is negative. Working of CMF is based on following principles :
Over a given period of consideration, note high and low. To look for accumulation /distribution over a single period, we need to compare closing price to the previous noted high and low. If the closing price is near to the high, it means accumulation is taking place. On the contrary , if the closing place is nearer to the low , it means distribution is taking place.
Positive or negative value of CMF is determined on the basis of price action. If the price of an asset is increasing on increasing volume, CMF is positive. On the other hand, if the price of an asset is decreasing on increasing volume, CMF is negative.
Positive CMF reflects the strength of bullish momentum in the market where as negative CMF reflects the strength of bearish momentum in the market.
Calculation of CMF
Chaikin money flow indicator is calculated in three steps as mentioned below:
Money Flow Multiplier.
MFM is calculated for each period based on following formula
Money Flow Multiplier = [(Close Value - Low Value) - (High Value - Close Value)] / (High Value - Low Value)
Money Flow Volume.
Money flow volume is calculated by multiplying money flow multiplier with volume of period under observation.
Money Flow Volume = Money Flow Multiplier X Volume for the Period
Chaikin Money Flow (CMF)
CMF is calculated by taking the average of 21 days money flow to rhe average of 21 days volume. Presuming the indicator is set over 21 period length. Numerical value will chamge as per settings.
CMF = 21-day Daily Money Flow Average / 21-day Volume Average
Let's take an example of any asset with following parameters and do some calculations :
Close price = $120
Low Price = $110
High Price = $125
Volume for the Period = $20,000
21 Period average of volume = $30,000
MFM = [(120 - 110) - (125 - 120)] / (125 - 110)
= (10 - 5) / 15
= 5/ 15
= 0.333MFV = 0.333 X $20,000
= $ 6600Chaikin Money Flow = $6,600 / $30,000
= + 0.22
It means that the token under consideration has CMF value above zero lime or in bullish (green) zone.
Demonstrate how to add the indicator to the chart on a platform other than the tradingview, highlighting how to modify the settings of the period(best setting).(screenshot required)
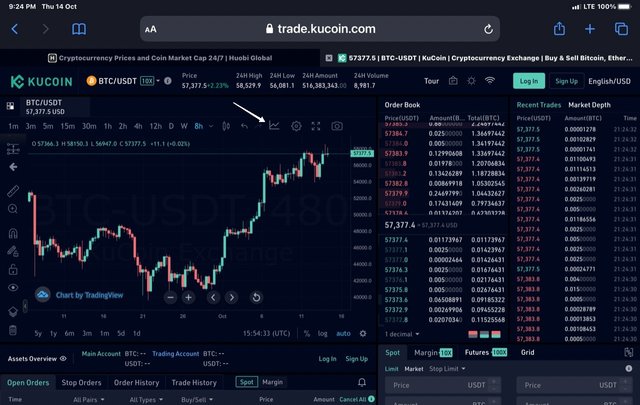
For this task, I will be using my Kucoin account to show CMF indicator and its configrarion.
- Go to kucoin official website https://m.kucoin.com/ and log in to your account.
Default trading pair is BTC /USDT . We can change it by clicking on trading pair.
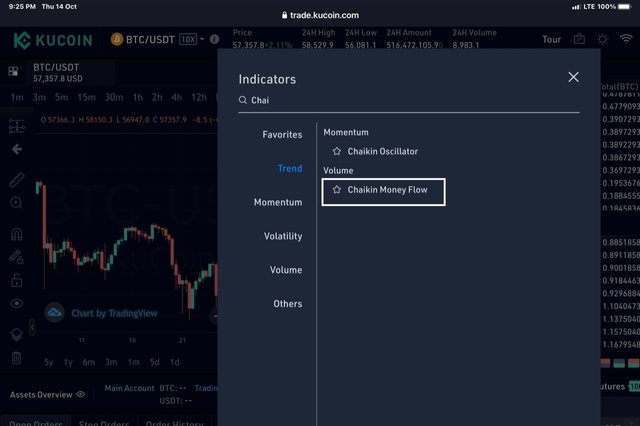
Next we click on indicator icon as shown below. A list of indicators will open . I searched for target indicator and selected Chaikin money flow .
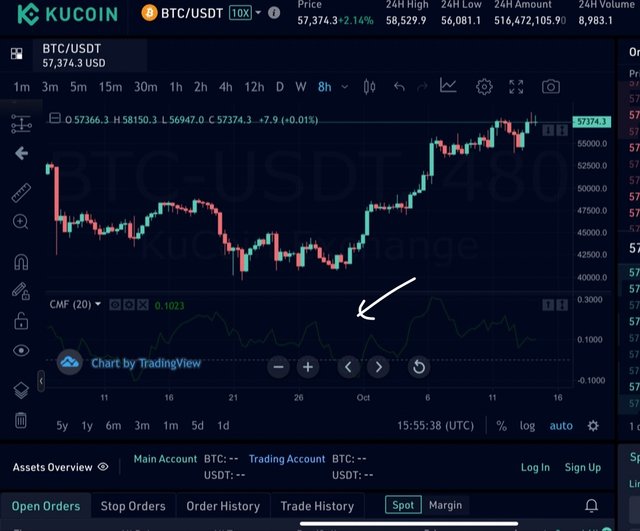
Go back to chart and CMF Indicator will be seen below the chart.
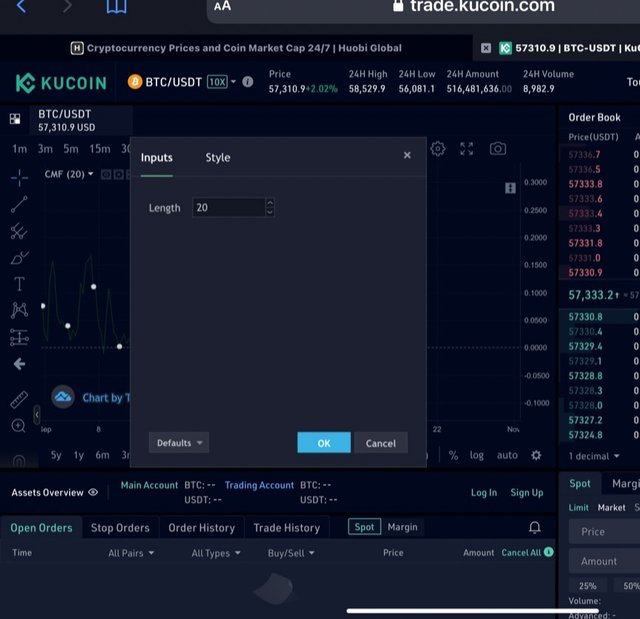
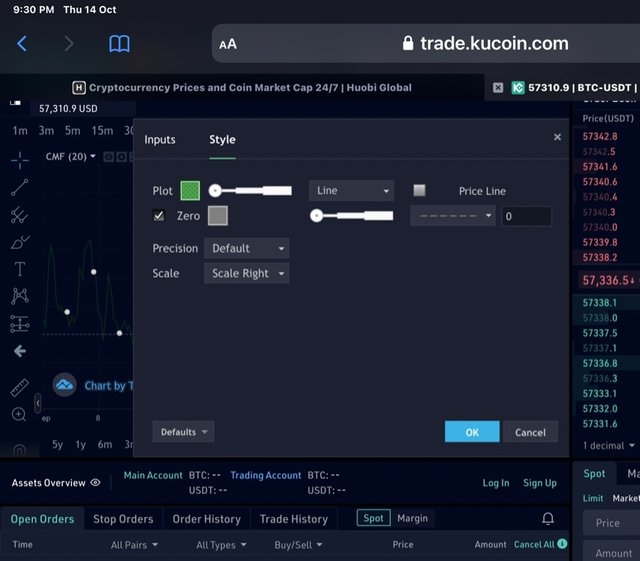
To configure the settings of indicator, double click on the indicator and setting will load. We have inputs and style setting. In input settings, we choose length and in style settings we got to choose color, precision and scale as shown below.
The default settings includes input length of 21 or 20 periods. However, it is not fixed. Traders can alter it as per their trading style. More longer the period, less sensitive is the indicator and less false signals will be generated. Shorter the period, more is sensitive and more is the market noise. So periodic length will depend upon trading style.
What is the indicator’s role in confirming the direction of trend and determining entry and exit points (buy/sell)؟(screenshot required)
To confirm the direction of trend, CMF has potential to determine strength and weakness of market. If price action and CMF sync over a signal, it means that the trend is confirn In that direction.
If CMF is moving above the zero towards positive side (green) on increasing volume and price, it confirms the direction the trend in upward direction and buy emtry can be spotted. In terms on money flow, it can be understood as flow of cash into the asset under consideration which inturn reflect the positive psychology of traders and their interest into the security.
On the contrary, if CMF moves below the zero line on increaaing volume. It indicates strong bearish trend and sell opportunity can be spotted.it means that the cash is flowing out of that security which inturn reflect the negative psychology of traders and their decreasing interest into the security.
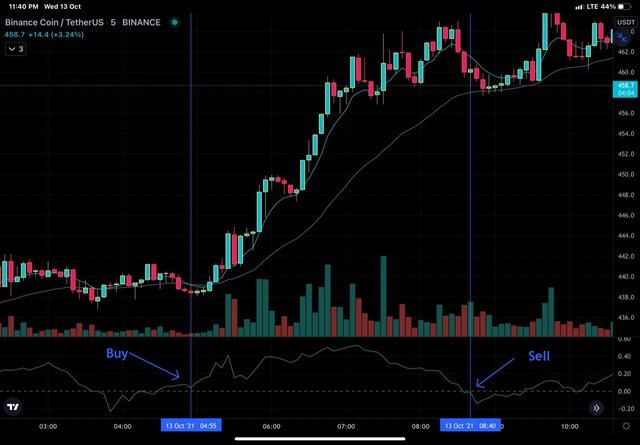
BNB/USDT chart taken from trading view app
In BNB/USDT chart above, i have shown crossover of CMF above and below the zero line with vertical lines and marked with arrows. I also markad buy and sell points corresponding to these crossovers. We can see the bullish price rally after positive crossover and bearish rally after negative crossover.
Trade with a crossover signal between the CMF and wider lines such as +/- 0.1 or +/- 0.15 or it can also be +/- 0.2, identify the most important signals that can be extracted using several examples. (screenshot required)
Trading with crossover is one more way of using CMF. We have to look for crossover between CMF and wider lines +/- 0.1 and or +/- 0.2 . The concept is simple to understand. Take a buy position when CMF crosses +0.1 line from below upwards and take sell position when CMF crosses -0. 1 line from above downwards.
As CMF line crosses above zero, it points towards increasing buying pressure and bullish trend. The trend is reinforced when it moves further up towards + 0.1 line. So buy position can be taken at + 0.1 and further progression of trade will be determined by setting a logical stop loss and take profit level . On the basis of CMF, exit from buy trade is confirmed by steep down move of CMF towards -0.1
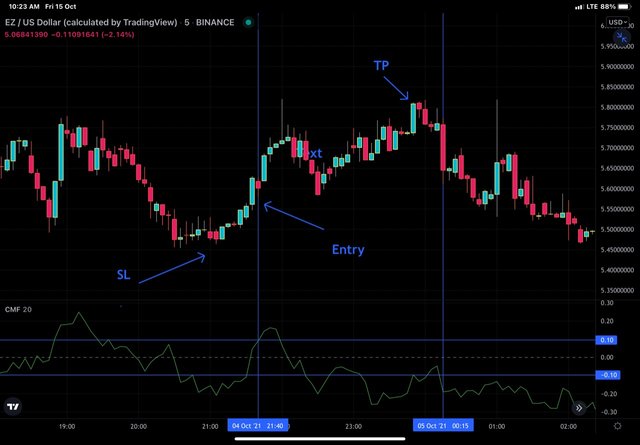
EZ/USDT chart taken from trading view app showing buy and exit on the bais of +/- 0.1
In the above chart, i have marked buy at crossing of CMF above + 0.1 and exit from buy position or take profit at crossing of CMF below - 0. 1 line. Take profit is set just below closing of bearish candle prior to entry. We can see that huge bullish rally of price after entry.
As CMF line crosses below zero, it points towards increasing selling pressure and bearish trend. The trend is confirmed when it moves further down towards -0.1 line. So sell position can be taken at - 0.1 and further progression of trade will be determined by setting a logical stop loss and take profit level . On the basis of CMF, exit from buy trade is confirmed by steep up move of CMF towards + 0.1
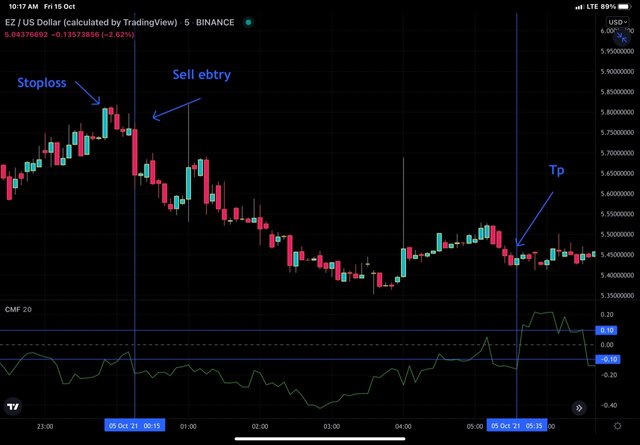
EZ/USDT chart taken from trading view app showing sell and exit on the basis of +/- 0.1 line
In the above chart, i have marked sell at crossing of CMF below - 0.1 and exit from sell position or take profit at crossing of CMF above + 0. 1 line. Take profit is set just above the closing of bullish candle just before entry. We can see that huge bearish rally of price after entering .
Example 2nd : BNB/USDT showing buy/sell signals
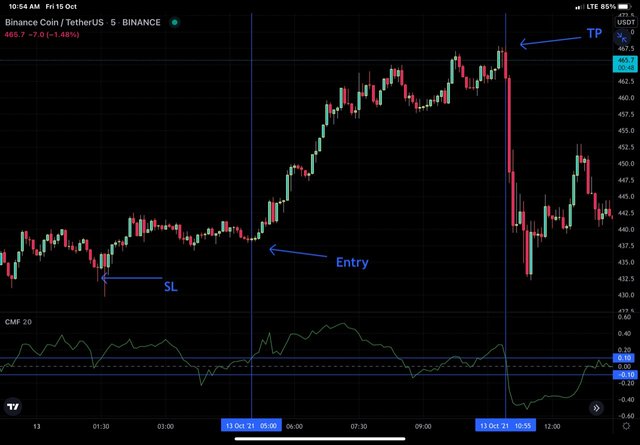
BNB/USDT showing buy, SL and TP on the basis of wide line +/-0.1
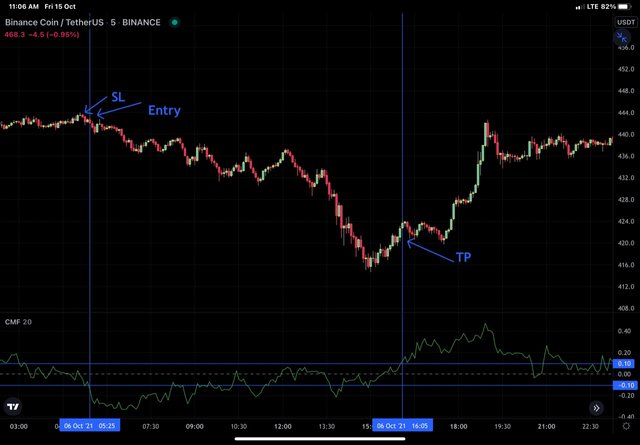
BNB/USDT showing sell, SL and TP on the basis of wide line +/- 0.1
How to trade with divergence between the CMF and the price line? Does this trading strategy produce false signals?(screenshot required)
Divergence refers to asynchronization of CMF and price action. Mostly we see that CMF and price action make similar moves. As price moves up, CMF also moves up and as price decreases CMF moves from above downward. So we can say , most of the times CMF and price action synchronise with each other. At times, variation of normal phenomenon is seen and that is known as divergence.
When the price of asset is moving up such that it makes higher high but CMF is making higher low. It means the current trend is weakening and is likely to reverse. So it is a case of bearish divergence and is a signaal to exit the buy position or short the market.
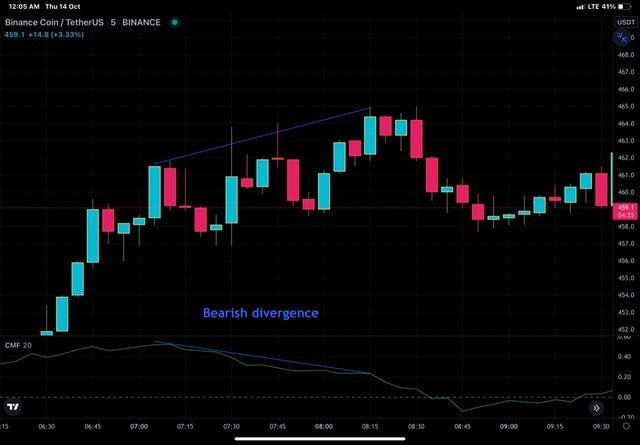
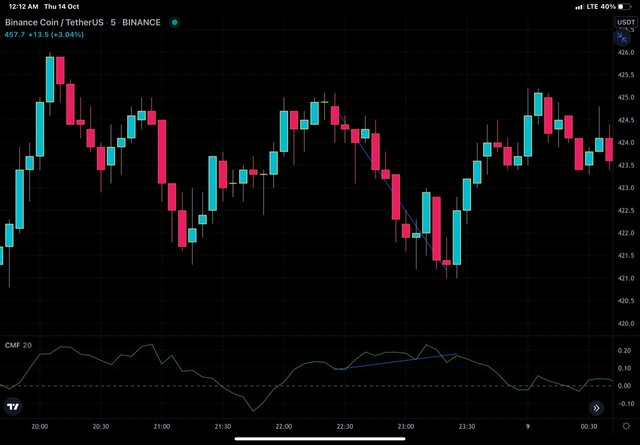
BNB/USDT chart taken from trading view app
In the above chart we can see that bearish divergence is seen on CMF and the price action has followed the indicator and shown dip thereafter.
The other scenario is that , when the price is moving down but CMF is moving up. The lower low movement of price correponds to lower high on CMF. It reflects forthcoming bullsih trend and is a signal to exit the sell position or take buy position.
BNB/USDT chart taken from trading view app showing bullisn divergence
In the chart above, we can see that CMF shows bullish divergence as price action is making lower low but CMF is not syncing with it. And the further progression of price does comply with the indicator by moving up.
Although divergences provide valid trading signals that work most of the times. But it is not 100% sensitive. It does generate false signals.
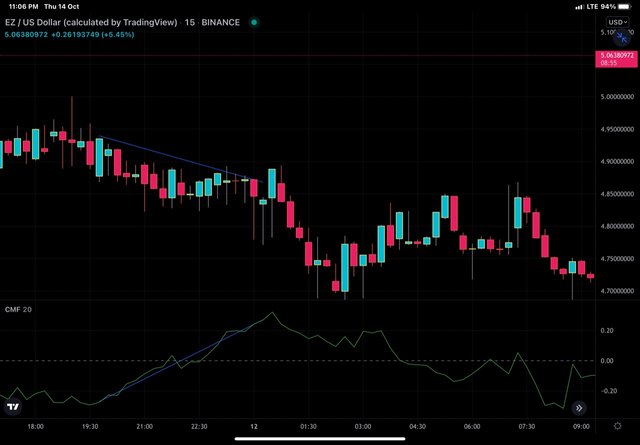
EZ/USDT chart taken from trading view app
We can see that strong bullish divergence on CMF is not followed by bullish momentum of price. So it is a false signal. Generation of false signals can be minimized by increasing the periodic length or by taking support from other indicators.
Conclusion
CMF is a very simple indicator that considers both price and volume of a security to generate signals. it provides signals on the basis of crossovers and divergences by fluctuating about a mean position. It is simple to use and configure. It can be beneficial tool when used along with other indicators.
Hi @drqamu
Thanks for participating in the Steemit Crypto Academy
Feedback
Total| 8.5/10
This is good content. Thanks for demonstrating your understanding of Trading using the Chaikin Money Flow Indicator.
You have been upvoted by @sapwood, a Country Representative from INDIA. We are voting with the Steemit Community Curator @steemcurator07 account to support the newcomers coming into Steemit.
Engagement is essential to foster a sense of community. Therefore we would request our members to visit each other's post and make insightful comments.
Thank you.