LEVERAGE WITH DERIVATIVES TRADING USING 5 MIN CHART-STEEM CRYPTOACADEMY-S6WEEK1-HOMEWORK POST FOR @reddileep
We are in season 6 week 1 of Cryptoacademy and learning has resumed after a long break. Today I am writing homework task for professor @reddileep which is about Leveraged trading. Let's begin :

Introduce Leverage Trading in your own words.
Leverage trading is a type of trade that is carried out with the help of borrowed funds unlike spot trading. In spot trading, traders are able to trade (long or short) number of tokens or shares or cryptocoins equal to the number of funds they possess or own. In leverage trading, traders are able to trade larger number of tokens then the funds they possess. The leveraged funds are borrowed from broker or exchange on which trade is performed. For example, if a trader takes 10x leverage, it means that a trader can buy or sell tokens 10 times more than the funds they posses from the burrowed funds. If a trader has $100 in his trading account and he takes 10 x leverage, it means that a trader can take trade worth $1000.
It seems fascinating concept because traders tend to focus on the profit that can be gained from the leveraged funds but ignore the the loss that can result, if the trade goes in wrong direction. It is therefore advisable to avoid leveraged trading as long as traders gain enough experience to have a favourable win/loss ratio. Pros and Cons of leveraged trading shall be discussed in subsequent sections.
What are the benefits of Leverage Trading?
Benefits of Leverage Traditing.
Leverage trading provide more purchasing power to the traders proportionate to the leverage taken. For example, with 100x leverage, a trader is conferred to have purchasing power 100 times to that of funds they possess.
Leverage trading provides opportunity to gain huge profits. With small amount of funds available, traders can take advantage of leveraged funds and amplify their profits.
Leverage trading allows traders to take advantage of timely market opportunities even if you have limited cash in hand.
Leverage trading allows for diversification because several positions can be opened with small amount of capital.
Leverage trading allows short/sell the market which is not possible in spot market. Therefore, traders can take advantage from rising as well as falling market.
What are the disadvantages of Leverage Trading?
Disadvantages of Leveraged trading.
Risk of losing funds disproportionate to the funds you own. For 10x leverage, a trader has chance to lose funds 10 times more than that with spot trade.
In case of insufficient margin to support the loss , additional loss in the form of interest has to be kept in mind too. Therefore, it is mandatory to maintain some minimum balance in your account for leverage trading.
In cross margin type of leverage trading, a trader can lose funds that are not directly involved in trade contrary to isolated margin type of trading where only funds put in trade are lost in case of wrong direction of trade.
Leverage trading charges roll over fee for holding position longer than 8 hours contrary to spot trading where no roll over fee is charged.
What are the Basic Indicators that we can use for Leverage Trading? (Need brief details for any essential Indicators and their purposes)
Use of indicators to find out trading opportunities is a common practice adopted by beginners before mustering price action. indicators can be used for all trading types. Let's discuss use of some indicators for leverage trading.
Moving Averages.
Moving averages are the most suitable indicators that can be used with leverage trading. To be more specific, exponential moving averages are useful for leverage trading as EMAs tend to focus on recent price . Smaller period EMAs like EMA 20 and EMA 50 are more relevant for leverage trading as traders usually wind up these positions in short periods.
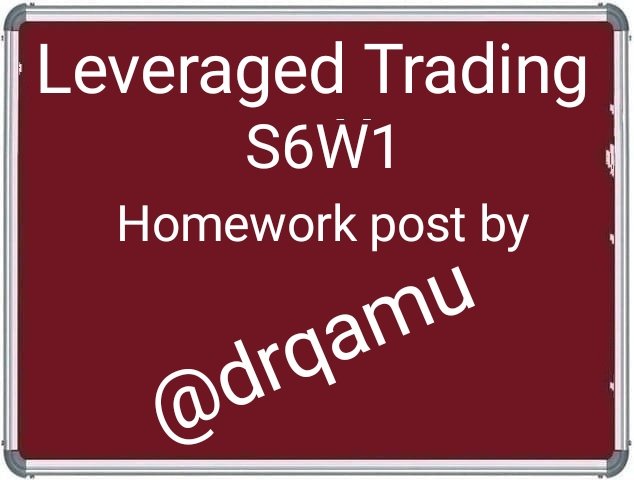
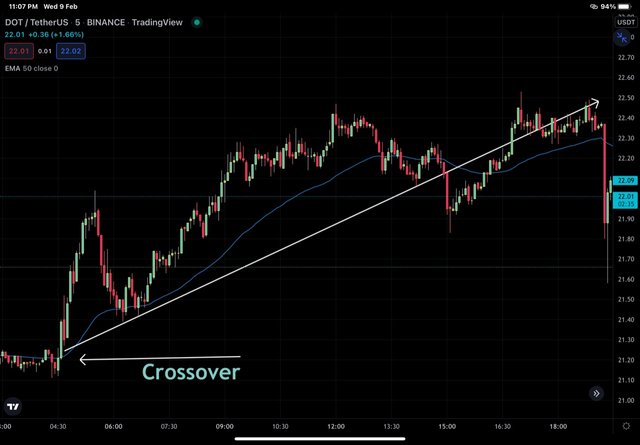
EMAs act as support in bull market and resistance in bear market. Traders take position on the basis of crossover between price line and EMA. Crossover of price line above EMA indicates buy signal and vice versa indicatea sell signal.
RSI in Leverage trading.
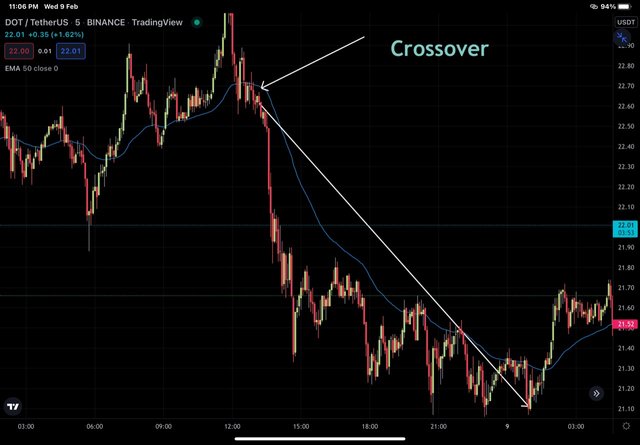
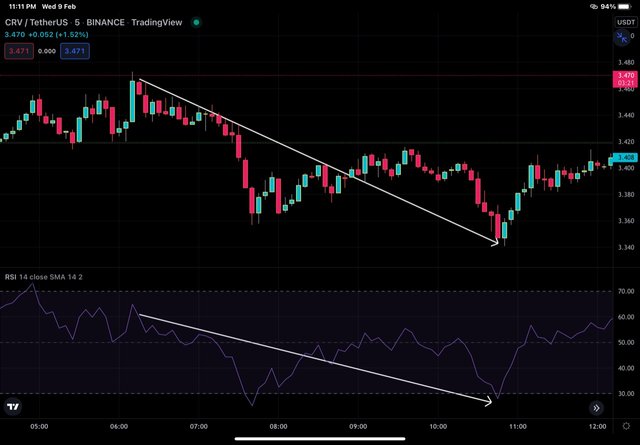
RSI stands for relative strength index and is a versatile indicator that's widely used by traders to anticipate the reversals and take positions on the basis of overbought and oversold zones indicated by the arbitrary values of RSI.
RSI value below 30 indicates an oversold zone and is therefore perceived as buy signals by traders in wake of forthcoming bullish movement of the price . Similarly an arbitrary value of above 70 indicates overbought zone and is perceived as a sell signal by the traders in the wake of forthcoming bearish price rally.
How to perform Leverage Trading using special trading strategies (Trading Practice using relevant indicators and strategies, Screenshots required)
We will make use of indicators as well as price action to be doubly sure before taking any position. Let's make use of EMAs and RSI along with price action.
As for MAs are concerned, I'll make use of EMA 20 and EMA 50 together along with RSI. For buy position, we will look for crossover between EMAs where EMA 20 must crossover EMA 50 from below upwards. RSI must be below 50 but projected upwards. On price chart, we should look for some important price action pattern, if any. Similarly, for aell position there must be reversereverse crossover, RMA50 must cross above EMA 20 and RSI must be above 50 and projecting downwards. Strategy for price action will remain same as that of buy position, that is, to look for some important price action pattern.
Buy position strategy.
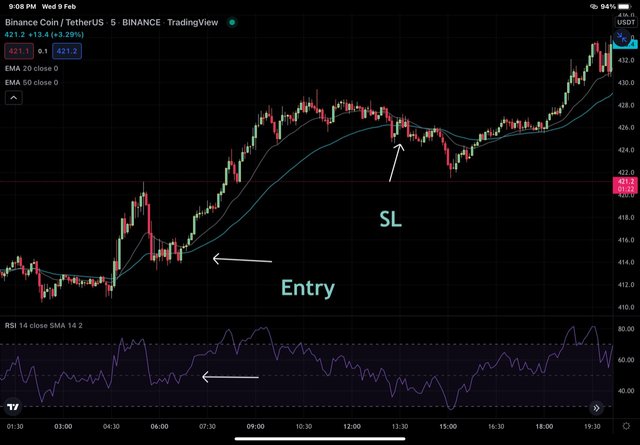
in the BNB/USDT chart above, buy position is taken when EMA 20 crossed abive EMA 50 . Secondly, RSI is ascending upwarda indicating bullish momentum. Here EMA 50 acts as a dynamic support and a stoploss level.
Sell position strategy
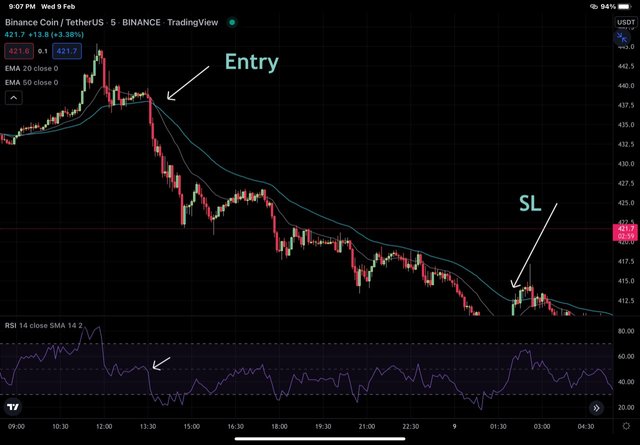
in the BNB/USDT chart above, sell position is taken when EMA 20 crossed below EMA 50 . Secondly, RSI is decending downwarda indicating bearish momentum.Here EMA 50 acts as a dynamic resistance
and a stoploss level.
Do a better Technical Analysis considering the above-explained trading strategy and make a real buy long or sell short position at a suitable entry point in any desired exchange platform. Then close that buy or sell position after appearing trend reversal signal from the Parabolic SAR indicator. Here you can also close your Buy or Sell position using any other desired Trading Method in addition to the signal coming from the Parabolic SAR indicator. However, here you must prove that trading method as a reason for closing your position. (Usually, You should demonstrate all the relevant details including entry point, exit point, resistance lines, support lines or any other trading pattern. Use at least 2X leverage and no more than 10X )
Parabolic SAR indicator alos known as Stop and reverse (SAR) system is used to find direction of trend along with reversal points and therefore help to make entry and exit. Parabolic SAR indicator appears as series of dots above or below the price line. If the dots are placed below the price line, it indicates uptrend and buy entry is advisable. If it is located above the price line, sell entry is advisable.
Working ot moving averages and RSI is already explained above. Now I'll combine above mentioned strategy to place a sell trade in ATOM/USDT.
Reasons for taking sell trade was Parabolic SAR above price line, secondly EMA 20 was below EMA 50 , RSI was down projecting and price line was also down with little bit of higher price rejection.
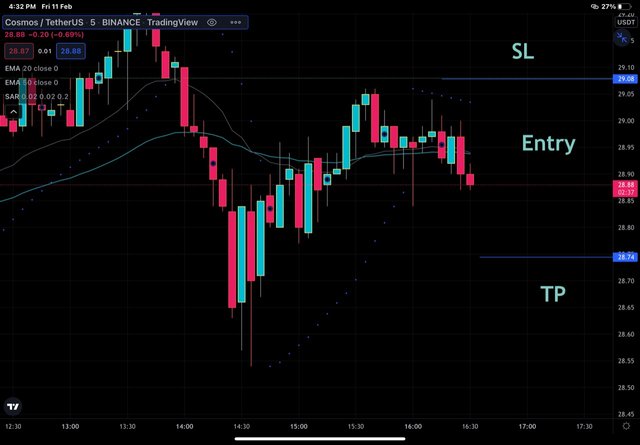
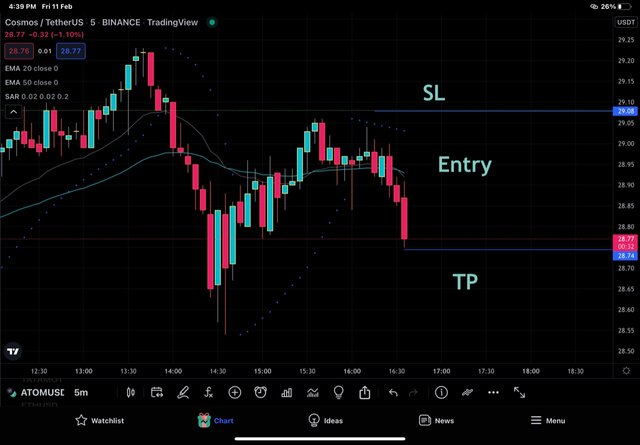
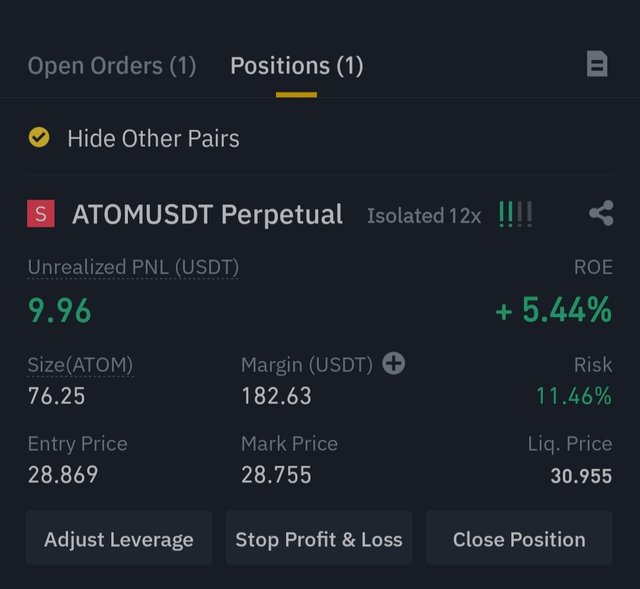
I entered at ATOM price of 28.869 USDT, placd SL just above SAR at 29.08 USDT and take profit at 28.75 USDT. Reason for placing TP there was support offered by that level during previous dip.
Conclusion
Leverage trade is a type of trade carried out with the help of leveraged funds. The benefit is that of amplification of profit and risk as well. It is high risk trading that required expertise to avoid heavy losses.
All charts /images used in this post represent my original works