[Crypto Trading with Price Action] - Crypto Academy / S6W2- Homework Post for @reminiscence01
Glad to continue learning in Crypto Academy. We are in season 6 week 2 Today I am writing homework task for professor @reminiscence01 which is about **Price Action. Let's begin.

Explain your understanding of price action.
We know that the sole purpose of trading is to earn profit. No one enters into trading with the intent to lose money but it is a separate story that most of the traders, at least during the initial months lose more than they gain. Such losses are due to multiple factors like inadequate knowledge, immature trading psychology or at times people suffer at hands of large cap investors as they possess capability to manipulate the market to generate liquidity for their block orders. So it is important for a trader to know the factors that determine price of an asset so as to minimize the loss and maximise the gain.
At least three well known price forecasting methods need to kept in mind before entering into trading and they are technical analysis, fundamental analysis and sentimental analysis. Price action is the core component of technical analysis. Fundamental analysis is aimed at looking fundamentals of asset like performance and potential of company, use case of asset, purpose of creation of token, team at work etc. Sentimental analysis as the name implies relies on the sentiments of people or we can say mood or attitude of people at any particular period of time.
Basically technical analysts do not ignore, fundamental and sentimental analysis. They believe that the price of asset is itself a reflection of fundamentals of the asset and sentiments of traders. It seems very catchy and i too believe it to be true. Price action study is therefore the most vital aspect of trading that has to be learnt, at least for scalpers and intraday traders.
Price action refere to the study of past price movement to determine important levels like support, resistance, stoploss and also entry and exit points. Price action study is carried out with the help of charts like Japanese candlestick charts where we look for some important price action patterns. Technical analysts after thorough study have delineated certain chart patterns that are formed on the basis of sentiments of the people and are expected to repeat when the similar sentiments arise in the future. Similarly, individual candles are symbol of sentiment over a particular time frame.
To foster the importance of price action, let me mention names of some Important chart patterns and candlestick patterns and the interpretation that can be drawn from them. For example, head and shoulder patrern is an indication of forthcoming bearish trend and inverse head and shoulder indicates forth coming bullish trend. Similarly, we have other patterns like flag and pole, Cup with handle, triangle patterns etc. Similarly, we have candlestick patrerns like morning star (bullish) , evening star (bearish) , hanging man (bearish) , shooting star etc. These candlesticks patrerns are made up of 3 to 4 candles. It is important to mention here that candlestick patterns when formed at a particular place are only valid. For example, morning star when formed at bottom is expected to be followed by bullish trend and evening star when formed at top is expected to be followed by bearish trend.
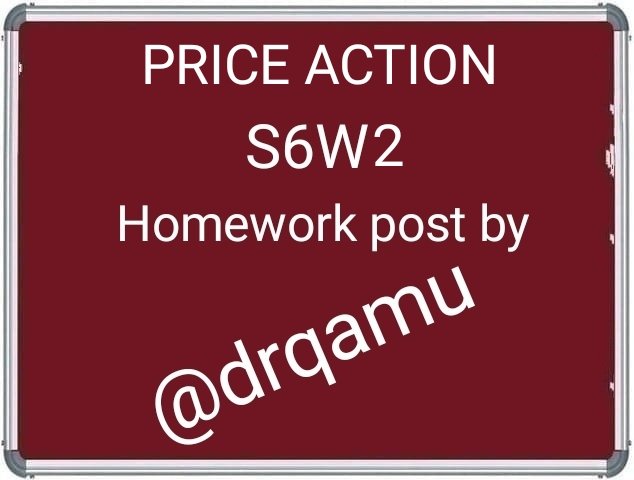
Double bottom pattern followed by bullish rally
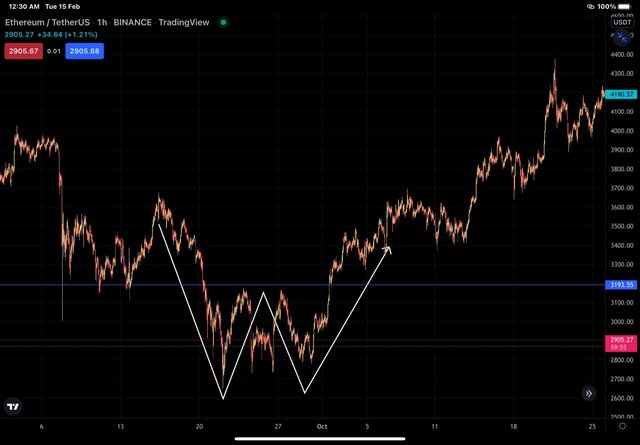
Bullish engulfing pattern followed by bullish rally of price
Our purpose here is not to discuss the individual chart patterns or candlestick pattern because each of these is a separate topic. Not only these chart and candlestick patterns but the individual Candle in itself represent the sentiment of the market. For example, a long green candle reflects bullish sentiment in the market at that point of time and a along red candle reflects bearish sentiment in the market and a DOJI candle indicates indecision in the market.
We can't deny the fact that most of the traders, at least for initial period of journey are only able to spot these patterns after their exhaustion and are not able to take advantage from them. However, with experience things get easy and better. For beginners, trading on the basis of support and resistance is profitable as well. Funds is simple, take buy position at suppoort and exit at resistance. However, breakout trader take buy at breaking up of resistance in upward direction and sell at breaking up of support in downward direction. Breakout of trend lines and understanding of Elliot market cycle are other concepts to take advantage from.
What is the importance of price action? Will, you chose any other form of technical analysis apart from price action? Give reasons for your answer.
Having discussed price action above, it is now easy to understand the use cases of the knowledge of prices action. Let's discuss it under few headings :
Market structure and price prediction.
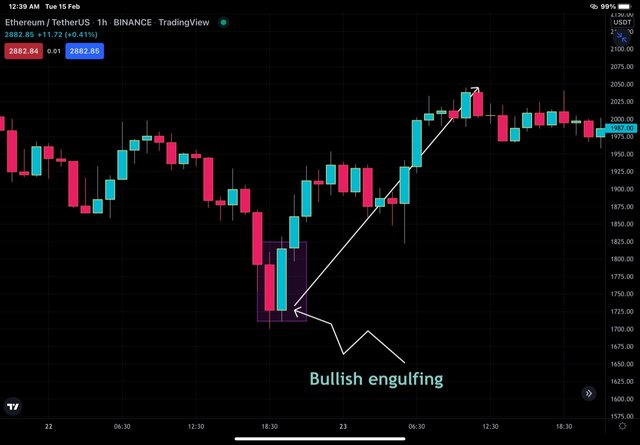
Double top pattern and bearish rally there lafter
By looking at price action, one gets a clear cut insight into the trend over a particular time frame. As mentioned earlier, each candle is representation of price movement at any particular period of time. By identifying the importance areas like support and resistance, a trader can predict the movement of price with fair degree of accuracy. The traders can therefore take positions for their advantage.
Proper trading plan.
Placing SL and TP as per different levels
The knowledge of price action help traders to form solid trading plan by setting Stoploss and take profit levels on the basis of important levels. For example, a price retesting a support can be take as buy signal with SL below the support and TP at the resistance. So instead of randomly placing these points, price action gives logic to set these levels.
Trader emotions and Psychology.
Technical analysts have studied various chart patterns that help traders judge the sentiment and psychology of traders in the market and take position accordingly. For example, an inverted head and shoulder pattern reflects strong bullish momentum in the market before the rally actually begins. Similarly, double top or double bottom pattern reflect emotions and psychology of traders in the market. So knowledge of price action is respecting and reflecting sentiments that can be materialized.
Filter Noise.
Multiple time frame analysis of price action help to filter out the noise generated in market. At times there is no clear cut trend in the market and we say market is choppy or indecisive . Such situations are frustrating for traders because they don't know the direction of trade. Price action is suitable in these circumstances.
Filter false and late signals.
Technical imdicators are tools developed on the basis of past study of price action to generate signals or indicate other useful market parameters. However, it is not uncommon to find the false signals generated by these indicators. Price action is useful to filter out these signals as well.
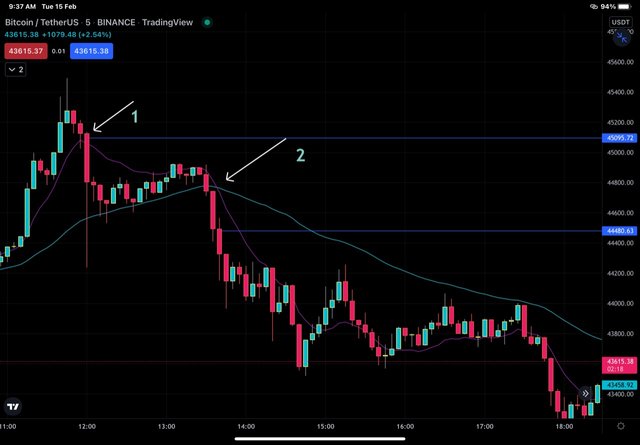
Delayed signal on the basis of crossover of EMAs filtered by price action
Apart from technical analysis, we can supplement our decisions by making use of indicators. Different indicators are meant to convey different information but no indicator is 100% accurate. All indicators need support from price action and trade execution in reality is always based on price action. The reason for taking support from indicators is to be double sure about what we are doing, otherwise price action is itself self reliant. Some of the indicators that i would use as supportive tools are RSI, moving averages, MACD and parabolic SAR. To be more specific, I use combination of moving averages like EMA 20 and EMA 50 for swing trades. In RSI, I search for divergences to support my price forcast based on price action. Parabolic SAR is used for scalping by me sometimes.
Explain the Japanese candlestick chart and its importance in technical analysis. Would you prefer any other technical chart apart from the candlestick chart?
Japanese candlesticks charts are the most commonly used type of charts for price action study for being informative and easy to interpret. JC charts represent the price movement of an asset for a particular timeframe and candlesticks combine together to form different chart patterns. If we analyse each candle for a particular time frame then we will be able to notice the price changes taking place in a particular asset every second. Shape of the candle is determined by four parameters of an asset and they are opening price, closing price, high price and low price.
The beauty of candlesticks lie in their ease of understanding despite the variety of information provided. The visual appearance of candles help us understand emotions linked to the market. A rally of green candles represents positive sentiments and vice versa with red candles. So candlestick charts represnt technical as well as psychological aspect of trade and traders.
Different candles and candlestick patterns have psychology behind them and they help in predicting future market movement and therefore gauge trading decisions. For example, morning star pattern is indicative of bullish future movement while as shooting star and evening star indicates forthcoming bearish market movement. As mentioned earlier, the location of candlestick patern is important. Morning star is more valid at support and evening star at resistance.
JC charts have been thoroughly studied and many important candle stick patterns have been delineated as has been mentioned in section one of this task.
I wouldn't prefer any other type of chart over JC charts but we can take support of Heikin Ashi chart and line chart in understanding trends in the market. For all other purposes JC charts are superior than all other charts.
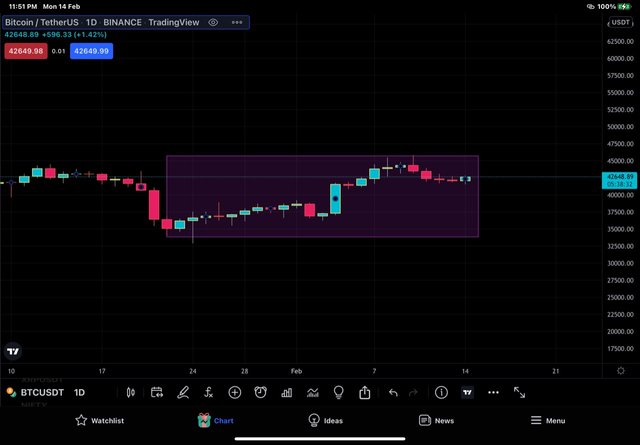
Indecision on JC chart
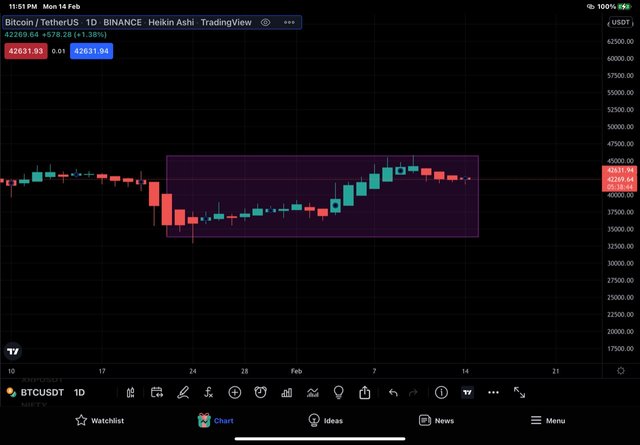
Filtering of noise on Heikin Ashi chart
Below are few reasons due to which I prefer JC Charts over other charts :
Candlesticks are much easy to comprehend. Even without analysing individual parameters of candle some information like trends can be understood.
Candlessticks provide very important information regarding various trading parameters like open price, close price, high and low price of an asset under consideration over a particular time frame.
Candlesticks charts provide more information than most of the other type of charts. Line charts are based on closing price only etc.
Candlestick patterns are very effective in carrying out trades as various patterns have been identified in markets and they point to different signals.
Candlesticks have been thoroughly studied alone as well as with other indicators and are therefore very good trading tools.
Japanese Candleeticks can be used on various time frames and are equally effective in all frames of reference. In contrast, heikin-ashi charts are reliable only on long-term time frames.
What do you understand by multi-timeframe analysis? State the importance of multi-timeframe analysis.
Multi-timeframe analysis is a sort of top down analysis of a trading pair. In simplified terms, multi-timeframe analysis refers to study of price action of a particular trading pair under different time frames starting from higher timeframe and moving down to lower time frame. It is important to find out vital points or levels like support and resistance and trends on higher time frames and lower times actually help in spotting the entries/exits.
Multi-timeframe analysis depends upon trading style and strategy . For example, a swing trader and scalper won't analyse the market on same timeframes. Swing trader who wish to hold his position for months should start from monthly time frame and move down to weekly, daily, 4 hourly and hourly. Monthly time frame will help in looking for trend and entry or exit can be sought on the basis of hourly time frames. Similarly, for a scalper, analysis has to come down from hourly to 30 mins and than to 15 min, 5 min or 1 min.
Importance of multi time frame analysis lies in filtering out the noise and spotting important levels to spot perfect entries and exits.
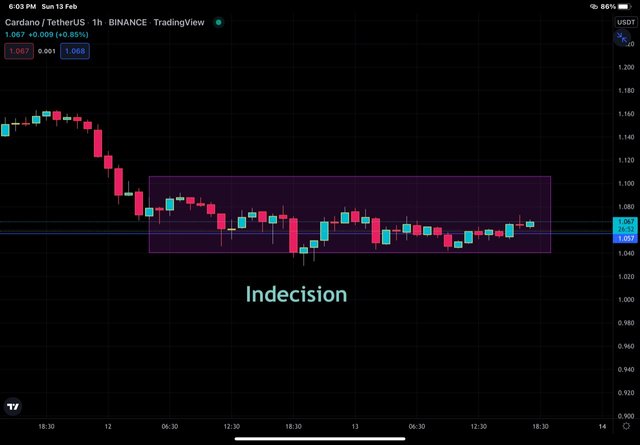
In the ADA/USDT chart above, we can see the indecisions as there is no trend in the market.In such cases, we will look at higher time frame like daily timeframe to cancel out this noise and have a clear picture of the direction of price.
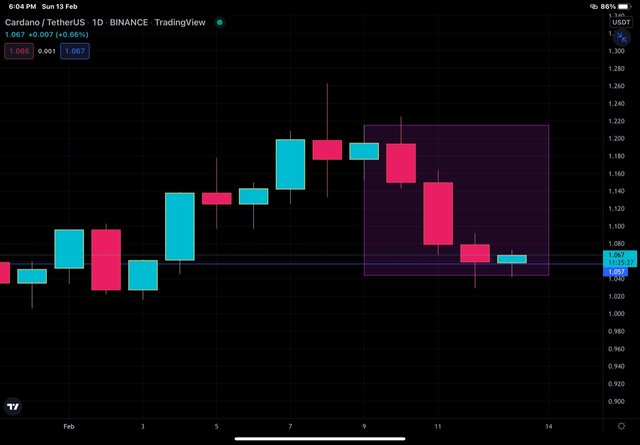
In the daily time frame of ADA/USDT above , we can see that there is clear downtrend over last 3 days. current day is although green but there is no strong green candle to indicate reversal .
With the aid of a crypto chart, explain how we can get a better entry position and tight stop loss using multi-timeframe analysis. You can use any timeframe of your choice.
Let's look at role of multi-timeframe analysis in spotting better entry position and placing tight stoploss. We will carry out top down analysts of ADA/USDT starting from daily time frame. As shown above, we have seen that the noise has been filtered by looking at daily time frame. Now that the downtrend is established, let's look for entry and Stoploss from multiple time frame study.
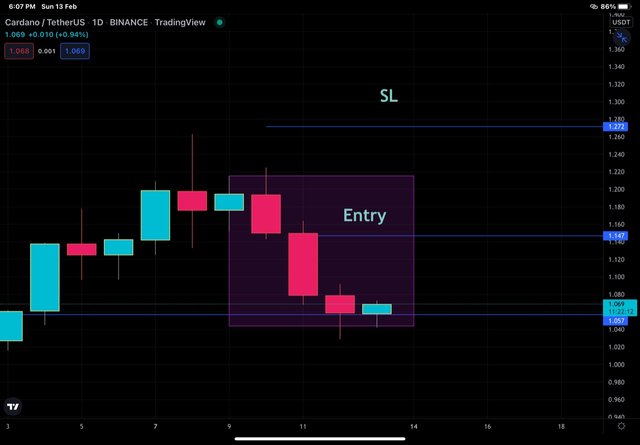
in the ADA/USST chart above set over daily time frame , let's say we entered into sell. position at ADA price of 1.147 USDT. We place stop loss above the upper wick of bearish DOJI and that is at 1.272 USDT. Let's presuma to have short 1000 ADA. So our SL will be about $125. Let's move to lower time frame now.
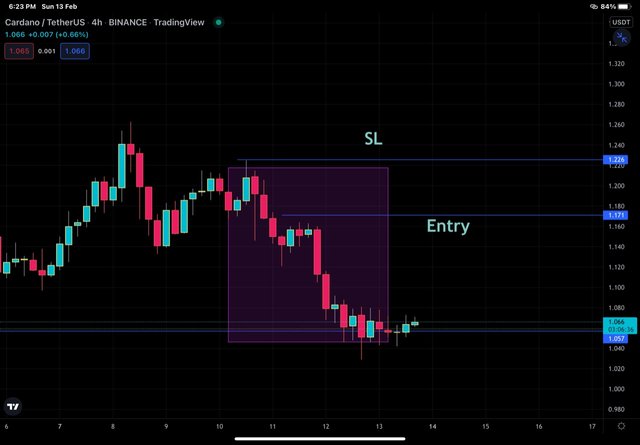
in the 4 hour ADA/USDT chart above, We can see that we can enter at third bearish candle because by than the bullish power is engulfed by two bearish candle. so our entry is at ADA price of 1.171 USDT and SL is at 1.276 USDT. For 1000 ADA, SL will be $105 which is still higher for me. Let's move further down and switch to 1h time frame.
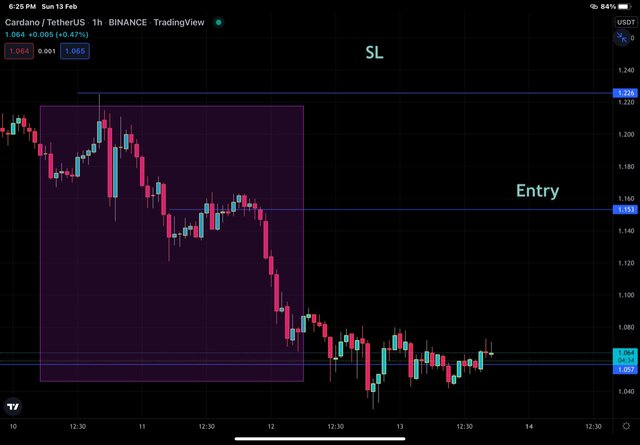
On the 1hr timeframe, we have placed entry after the bullish power of a candle formed after long bearish candle has been nullified by 5 bearish candles at ADA price of 1.153 USDT and stoploss at ADA price of 1.226 USDT. In this way, for our order of thousand ADA, stop loss has decrease to 73 USDT.
So it clear from multi timeframe analysts that we are able to spot better entries and place tighter Stoploss.
Carry out a multi-timeframe analysis on any crypto pair identifying support and resistance levels. Execute a buy or sell order using any demo account. (Explain your entry and exit strategies. Also, show proof of transaction).
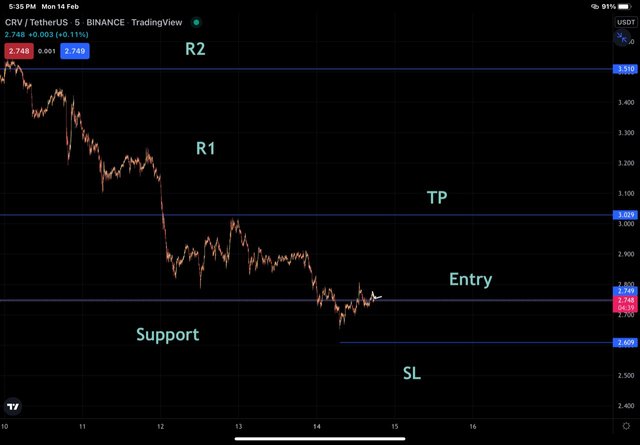
Here I am carrying out the multi time frame analysis of CRV/USD token, I'll start from 1 hours time and then switch to 15 minutes followed by 5 minutes. I'll use 5 minutes time frame to enter the market and place stoploss and take profit levels.
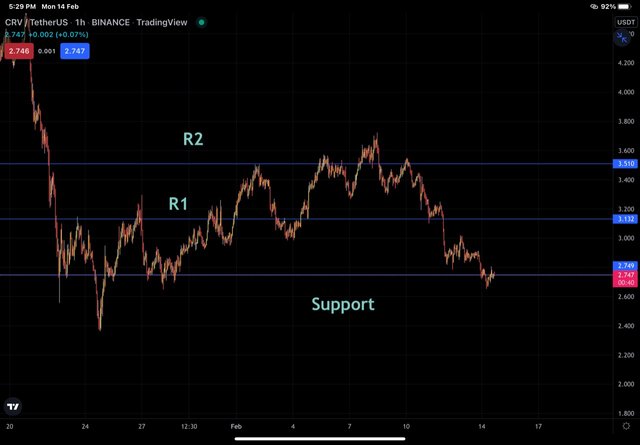
In the 1h chart of CRV/USDT, I have identified a support level which is tested by price multiple times and then I have identified two resistance levels marked as R1 and R2.
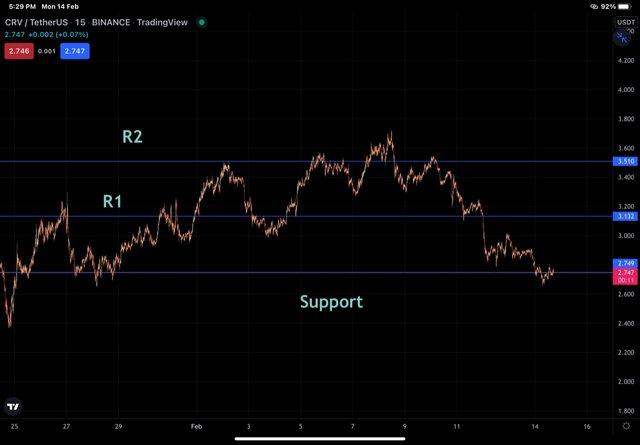
In the 15 min chart of CRV/USDT, the support and resistance levels that have been identified on 1 hour time time are respected fully, so I need not change my levels.
In the 5 min chart of CRV/USDT, the support and resistance levels that have been identified on the higher time frames have been moved down for proper entry and tighter stop-loss. I place entry at CRV price of 2.749 USDT and set stop loss just below the support level that's at CRV price of 2.609 USDT and takeprofit was placed at the first resistance level found on 5 minutes time frame which was at CRV price of 3.029 USDT.
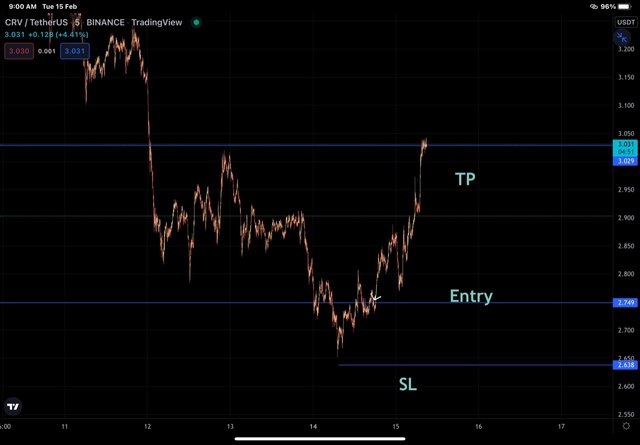
In the chart above, we can see that the take profit level has been attained.

Conclusion
Price action is the study of past price movement and the levels established by the price movement in the past and extrapolate those levels to gain entry and exit into the market. It also involves the knowledge of various chart patterns and the candlestick patterns and their identification on time so as to be able to materialise them. We have seen the role of Japanese candlestick charts in study of price action . We have also seen that how multi time frame analysis of of price action is doing wonders.
Hello @drqamu , I’m glad you participated in the 2nd week Season 6 at the Steemit Crypto Academy. Your grades in this task are as follows:
Recommendation / Feedback:
Thank you for participating in this homework task.
Thank you
Hello dear @drqamu, you took back your delegation from steemkidss, hope there is no problem?