Crypto Trading with Moving Average - Crypto Academy |S6W2| - Homework Post for Professor @shemul21.
Today I am writing homework task for professor @shemul21 which is about Moving Averages. Let's begin:
Explain Your Understanding of Moving Average.
Moving averages is a trend following, customisable but lagging technical indicator that is commonly used by traders for multiple purposes. Moving average as the name implies represent the average price of an asset at a particular time as compared to there whole period over which moving average is set. For example, a 20 day moving average line over a chart at any point would tell us the price of that asset compared to the last 20 days average price. The advantage accrued out of averaging the price is that the short-term fluctuations in the price are grossly mitigated.
The purpose of using moving average is to identify the trend in the market. If the moving average is directed upwards, it indicate the bullish momentum and if it is directed downwards, it indicates bearish momentum. Moving average also acts as a dynamic support and resistance line and can therefore be used by traders for taking some important trading decisions like entry and exit.
Being customisable, a trader can select the period according to their own convenience and trading style. Having mentioned above that it is the lagging indicator, it is so because it is based on the past price movement. Moreover , lag of the indicator is proportional to the period of the indicator selected which means that for longer period moving averages lag is more compared to the short period moving average.
Moving averages are widely used either directly or indirectly through indicators that make use of moving averages like MACD,Bollinger bands, Alligator indicators, RSI etc.
What Are The Different Types of Moving Average? Differentiate Between Them.
Simple Moving Average (SMA)
Simple Moving Average is the simple mathematical mean of prices. In mathematics , we say mean is equal to sum of observations / number of observation but in Finance observation refers to the price of an asset. So simple moving average over a specified period of time is equal to sum of the prices divided by the number of days. Let's say we take example of 5 days SMA . Let's represent prices by P1 , P2, P3, P4, and P5.
SMA = P1+ P2+ P3+ P4 + P6 /5
From the above calculation, we can infer that SMA gives equal weighttage to all the price over a specified period. Such a method of calculation gives a clear insight that it may result in lag.
Exponential Moving Averages
Exponential moving average is that type of moving average where more emphasis is given to the recent price. Such a method of calculation make it more responsive to the new price change and therefore tackle the issue of lagging as seen by SMA.
Formula for calculating EMA is as ;
EMA=Price(t)×k+EMA(y)×(1−k)
where:
t=today
y=yesterday
N=number of days in EMA
k is multiplier which is calculated by =2÷(N+1)
Weighed Moving Averages
Weighted moving average is similar to EMA where more weight is given to recent price points than the farther points over a specified period of time. The addition is carried out in such a manner that sum equals 1 or 100%.
WMA = (Price1 × n + Price2 × (n-1) +...Pricen)/ [ n × (n+1)/2]
n = Period(number of days)
Too much of calculations have been mentioned, let's point out some theoretical differences :
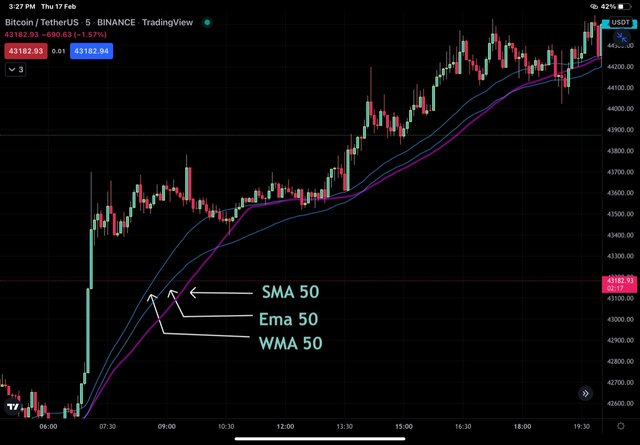
Differences between SMA, EMA and WMA.
Simple moving average put equal emphasis on closing price of all days over a specified period while as WMA give more Weighiage to recent data and EMA smoothes out the price with the help of multiplying factor.
SMA is more suitable for long term swing traders , EMA is more suitable for short term swing traders and WMA is good for scalpers.
SMA is more reliable on longer time frame, EMA on shorter and WMA on both longer and shorter time frames.
SMA lags behind price, EMA and WMA reacts faster to price changes.
Identify Entry and Exit Points Using Moving Average. (Demonstrate with Screenshots)
Study of any indicator is meant to generate trading signals. Moving averages are best indicators to act as support and resistance in trending market. I'll make use of two moving averages , one SMA and one EMA to spot entry nnd exit position. I'll use 20 period EMA and 100 period SMA. Following are criteria to spot entry and exit.
For buy position, both MAs must be projected upwards.
Smaller period MA has to be above longer period MA.
Entry for buy position is taken when price takes support from 20 EMA and meets bearish rejection. it is preferable to have a long bullish candle to confirm entry
Entry for bearish position would be taken when 20EMA acts as dynamic resistance. Entry is taken when price meets bullish rejection from 20 EMA and enrry is taken on long red candle.
Exit can be taken at crossover of MAs or on the basis of logical SL/TP.
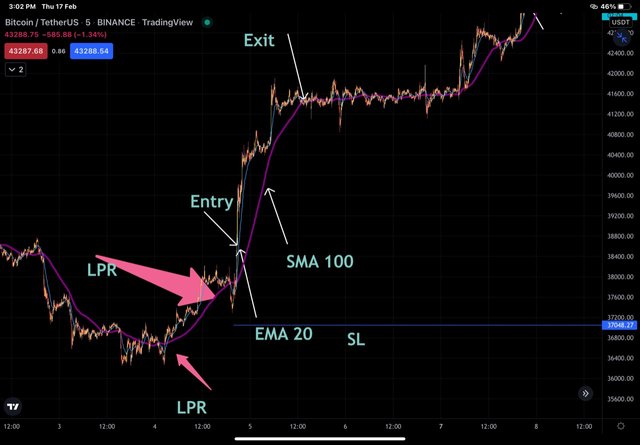
Buy Entry and Exit criteria
in the BTC/USDT Chart above, buy entry is taken when price shows bearish rejection . Entry is made after retesting of EMA 20 on a strong bullish candle. SL is placed below SMA 200 and TP at reversal.
Sell Entry /Exit Criteria
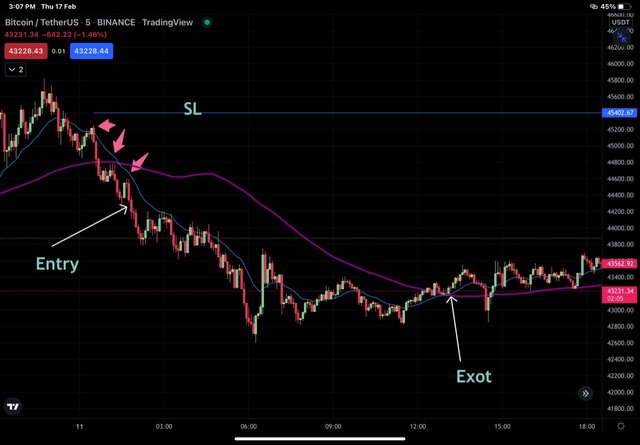
in the BTC/USDT Chart above, sell entry is taken when price shows bullishh rejection and is below both EMAs. Entry is made after retesting of EMA 20is a strong bearish candle. SL is placed aboveSMA 200 and TP at reversal when price moved above both EMAs.
What do you understand by Crossover? Explain in Your Own Words.
For crossover of moving averages, I'll use two moving averages like EMA 50 and EMA 200. Short moving averages move faster and it moves closer to the price line where as long moving average is slower and remains far from the price line.
Short moving average of 50 periods is based on average price of last 50 days on a daily time frame , last 50 minutes on 1 minute time frame and last 50 hours on an hourly time frame. So short moving average indicates more recent price change and it is this indicator on the basis of which traders gain entry into the market.
Long moving average of 200 periods indicates price moment over 200 days on a daily time frame , 200 hours on hourly time frame and 200 minutes on 1 minute time frame . So this indicator takes into account farther price movement in relation to the current value. So crossover of short moving average above or below the long moving average confirms trend reversal.
The principles of working on the basis of crossover are as below :
- For bullish crossover, EMA 50 must cross above EMA 200. Buy enter position is taken after bullish crossover preferably after retesting of short EMA. Exit is taken at reverse crossover.
- For bearish crossover, EMA 50 must cross below EMA 200. Sell entry position is taken after bearish crossover preferably after retesting of short EMA. Exit is taken at reverse crossover.
Bullish Crossover
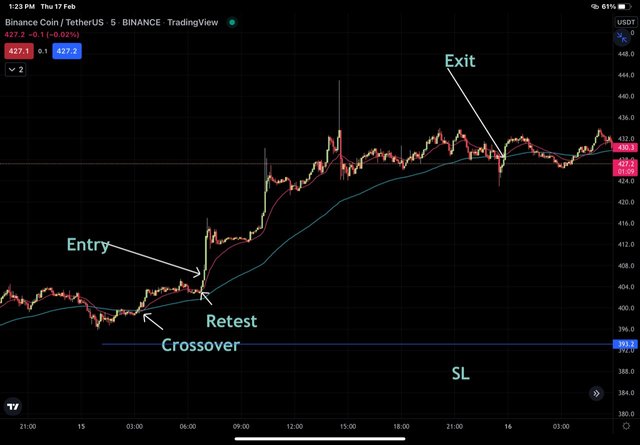
in the BNB/USDT Chart above, bullish crossover is seen when EMA 20 cross above EMA100 from below upwards. Entry is taken after retesting of EMAs on a strong bullish candle. Stoploss is set just below the the longer EMA and Exit or take profit is set at reverse crossover between two EMAs.
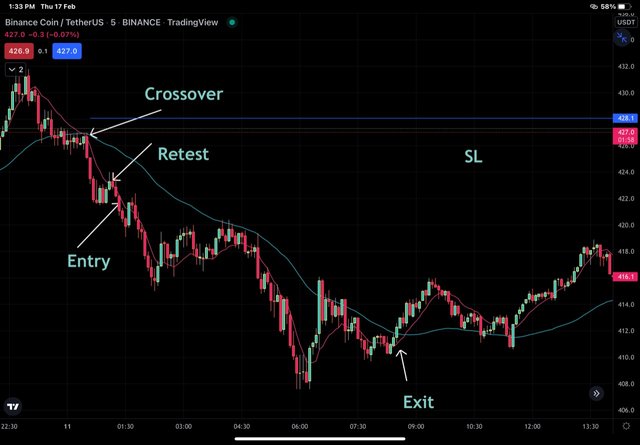
Bearish crossover
in the BNB/USDT Chart above, bearish crossover is seen when EMA 20 cross below EMA100 from above downwards. Entry is taken after retesting of EMAs on a bearish candle. Stoploss is set just above the longer EMA and Exit or take profit is set at reverse crossover between two EMAs.
Explain The Limitations of Moving Average.
We know that, none of the technical analysis indicators is absolute and so none of them can be used as standalone tool. All of them have certain limitations and some hold true for moving averages too. Limitations of moving average are as below:
Moving averages are calculated on the basis of past price action and on that basis inferences are drawn on the trading parameters like entry and exit . we know that, Crypto price is determined by multiple factors other than past price. MAs neglect those factors.
Being a lagging indicator, the signals generated on the basis of moving average lag behind. Actions taken by traders are slightly late than Ideal time of execution. Slight amount of the profit is missed out.
Moving averages are known as trend following indicators as their work best in trending market . These indicators do not work well in sideways market.
There are no definite and preset time periods for moving averages. They have to be customised according to the traders experience and trading style.
Conclusion.
Moving averages are technical indicators that are commonly used by traders . They are either used alone or in combination to spot opportunities. As they are based on past price action, they are lagging indicators. They work well in trendimg markets but not in ranging markets
