My Homework Week 2: by Professor @stream4u | Meaning of the Green and Red candle and how to read the Green and Red candle, with candles image
Special appreciate goes to @steemcurator01, @steemcurator02, @steemitblog, Professor @stream4u and other professors for all their especially during the classes and teachings.
In response to the first Topic of my home work which is Explain what is the meaning of the Green and Red candle and how to read the Green and Red candle, with candles image.(Screenshot Needed)
The price market of crypto coins keep changing every time and just like we were taught in our first class that the price can either move upward which is called Uptrend or move downward which is called downtrend and also we were taught that the technical chart also called candlestick chart is use to view the movement.
One thing too note is that on this candlestick chart, we have candles that can be either green and red
The Green Candle show that the closing price is higher than the starting price on the particular time, day or weeks that is view while
The Red candle show that the closing price is lower than the opening price.
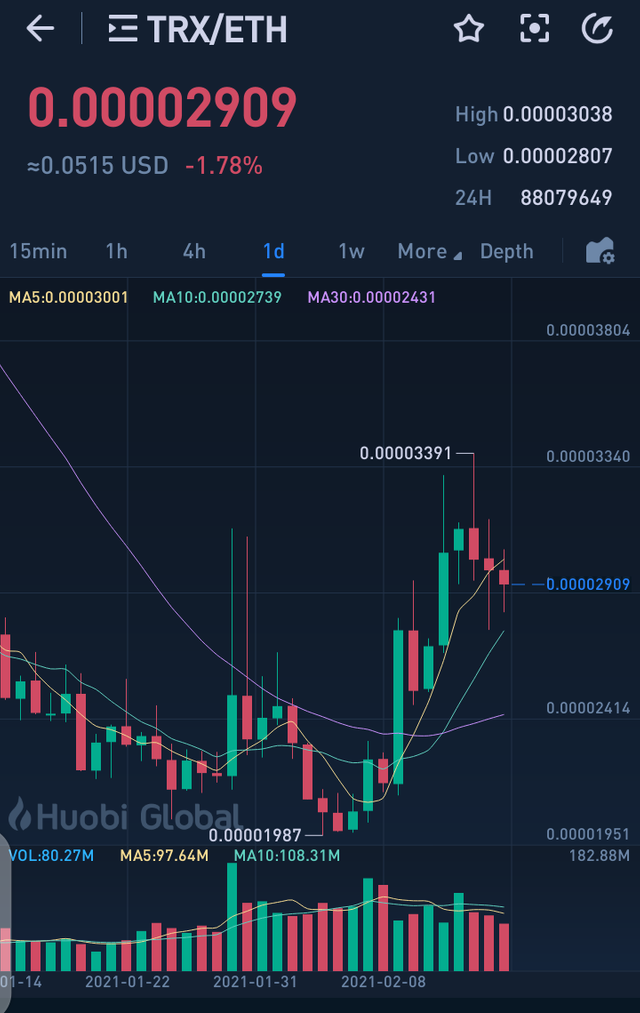
I used Huobi Global exchange to view the candlestick for TRX trading to Ethereum.
From the screenshot we can view for 15minute, 1hour, 4hours, 1day, I week and many more. For the seek of my illustration I pick daily view, which implies that each candle will represent a day.
From the screenshot we can see the green and the red candles for difference day.
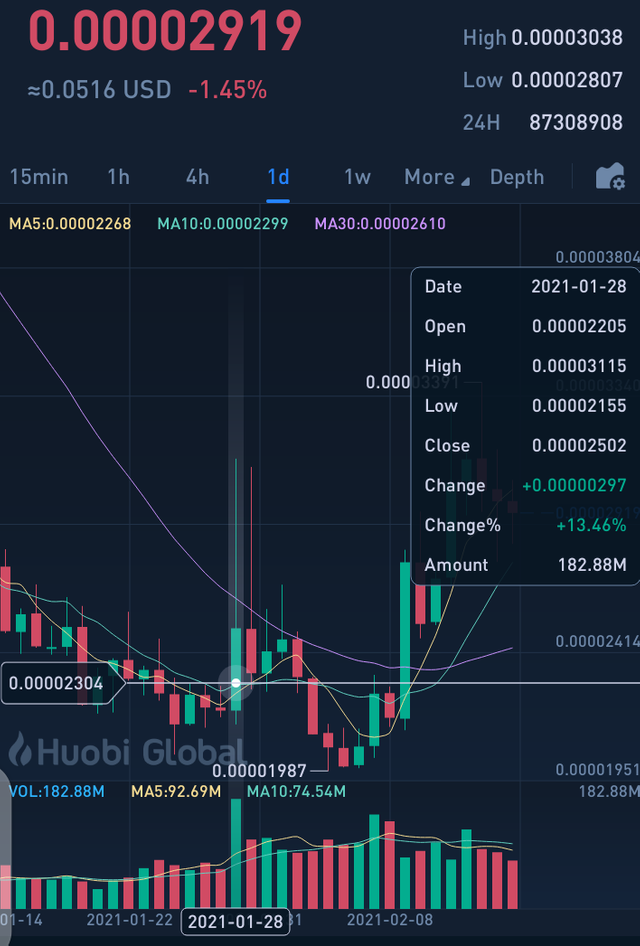
When I clicked on one of the candle it will display for day for example
This candle which is green for 28th of January 2021
Once you click on it, The following information are displayed: date of the candle, open price for the day, high price, low price, close price for the day and the positive change that make he candle to be green, the change percentage and the overall amount in transaction for the day.
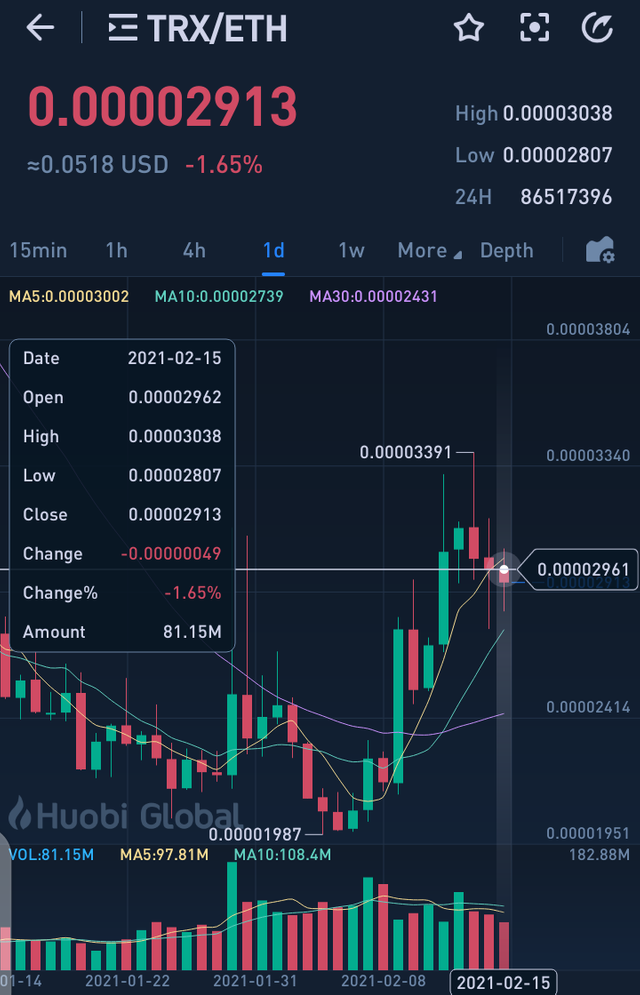
Let us look at the candle for today 15th February, 2021
So far as of the time I am writing this post, the candlestick is red and when I clicked on it. The displayed information are the date of the candle, open price, high price, low price, close price and the change. Take note the change that occur is carrying negative -0.00000049 and the percentage of change that occur today is also negative -1.65% . This show that the price drop today.
This candlestick chat can really help investors during trading of the TRX coin which I use as an example here.
If you are a short term or long term investor then what you need to do is just to readjust your time of view of the candlestick chat in other to help you to know when to buy or sell your coins.
Thanks for reading my homework.
Cc: @steemcurator01
Cc: @steemcurator02
Cc: @gbenga
Cc: @stream4u


