Technical Indicators 2 / Crypto Academy / S4W4- Homework Post for @reminiscence01".
QUESTION 1
a) Explain leading and lagging indicators in detail. Also, give examples of each of them.
b)with relevant screenshots from your chart, give a technical explanation of the market reaction on any of the examples given in question 1a. do this for both leading and lagging indicators
Leading and Lagging Indicators
Leading Indicators
Leading indicators can be define in simple terms as any observable or measurable variable, in relation to interest which is used in measuring or predicting the changes in prices before they occur.
With the usage of leading indicators, we can forecast the magnitude, the timing, the duration of a crypocurrency. It is true that the leading indicator faces what we commonly call trade-offs in terms of precision, accuracy, and the lead time. Meaning that the leading indicator catches the trend quite early enough and gives you the sentiment of the market. It is preferable using the leading indicator in ranging markets as well as short term trading rather than trending markets and long term respectively.
Examples of leading indicators include;
- Bollinger Bands
- KDJ
- Average direction movement
- stochasics
- Relative Strenght Index
- Donchian channel
We can see the formation in the screenshot below.
Lagging Indicators
Lagging indicators happen to be the opposite of the leading indicator, they measure and observe the changes in the prices after the main factors causing it. Meaning that the leading indicators confirm changes in trends.
The lagging indicator is known to be one of the trials of the underlying price action of a crypocurrency. So with the lagging indicator we see it apparent after we have had a large shift. In tis regards it is preferable to use the lagging indicator in long-term trading.
Examples include;
- Moving average convergence divergence
- Ichimoku kinko hyo
- Simple moving average
- Parabolic SAR
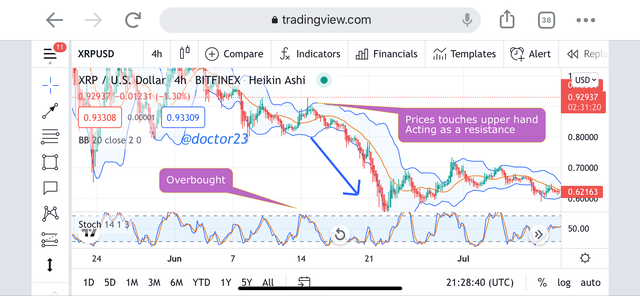
Examples of leading Indicator on a chart
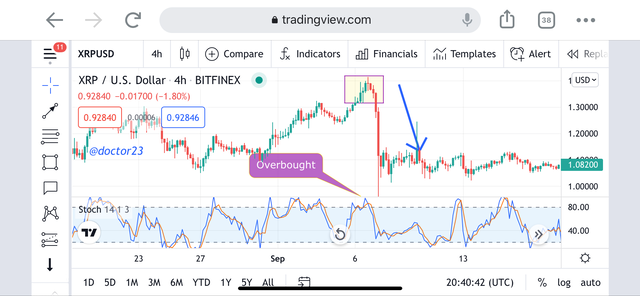
We see the formation of Overbought which shows buyers are exhausted in buying, and possible reversals.
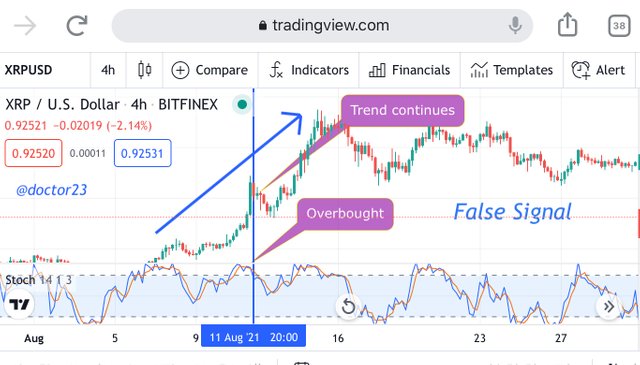
Not all the time we have a perfect formation: we can see from the screenshot below with the stochastic showing overbought, while the trend continues
Example of Lagging Indicator on a chart
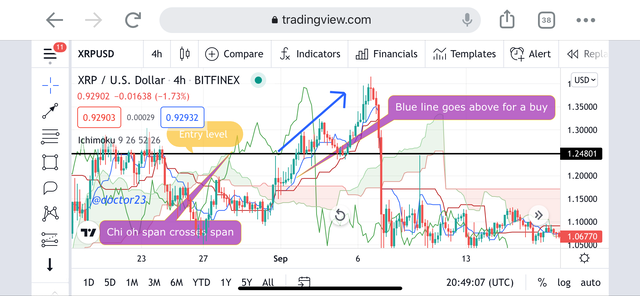
Blue line goes above red line, indicating a trend reversals while the chikou span crosses the span for further confirmation.
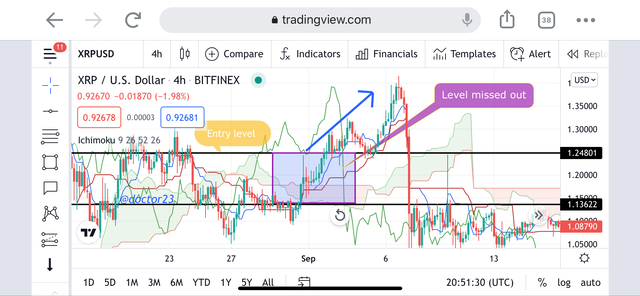
Not all the time we have a perfect formation: we can see from the screenshot that we missed out the early part of the trend.

QUESTION 2
a) What are the factors to consider when using an indicator?
b) Explain confluence in cryptocurrency trading. Pick a cryptocurrency pair of your choice and analyze the crypto pair using a confluence of any technical analysis tools.
Factors to Consider when using an Indicator
Trading Style
Before choosing an indicator, you need to first of all know your trading style. Knowing your trading style here means you need to decide if you are a scalper trader or a swing trader. This is because knowing the trader type you are will determine the type of indicators you are to use. For example if you are a scalper trader it obviously means you will be taking short term trades. This is means leading indicators will be quite suitable for this type of trading style and if you are to be a swing trader then you will probably need lagging indicators such as the moving averages to spot your entries.
Market Trend
Next here I will be talking of the market trend. It is important to know the trend of the market in order to know what indicator to use. Let me explain further by the use of examples. We normally have two types of markets which are the trending market and the ranging markets. With the trending markets it is important to use lagging indicators such as the ichimoku kinko hyo indicator. And in ranging markets we can use a leading indicator to show potential overbought and oversold regions such as the stochastics.
Understanding the Indicator
After knowing the market trend and the trading style, it is now important to know the usage of the indicator we choose. For example in the case of the usage stochastic indicator, we need to know we will be finding potential overbought and oversold regions. And in the usage of moving averages we need to see the prices go above or below the indicator line signaling a buy and sell order respectively.
Confluence
Confluence is the usage of 2 or more technical indicators at a time. The problem here is always to know how to choose them which much accuracy to avoid conflicting signals and no also filling the charts with many indicators as it will end up making everything confusing. An example of good combinations include; ickimoku and stochastics, kdj and moving averages, Bollinger bands and stochastics.
Confluence in Cryptocurrency
Going to the definition of confluence, we see it as a scenario which happens when two or rivers meet. In cryptocurrency it is a scenario which happens when we use multiple indicators or strategy to confirm a signal. This is actually useful in the trading as it increases the probability of the winning of the signals.
I will explain the usage of the confluence with the Bollinger bands and stochastics indicator. The stochastics indicator shows potential overbought and oversold regions while the Bollinger bands shows areas of support and resistance.

QUESTION 3
a) explain how you can filter false signals from an indicator
b) explain your understanding of divergence and how they can help in making a good trading decision
c) using relevant screenshots and an indicator of your choice, explain bullish and bearish divergences on any cryptocurrency pair.
How to filter out false signals from and indicator
Indicators are normally not 100% accurate, it is for this reason that we have to filter out false signals and this can be done with the usage of price action in addition to the signal from the indicator.
I will begin by showing a scenario in which we have the fake signal from the stochastic indicator.
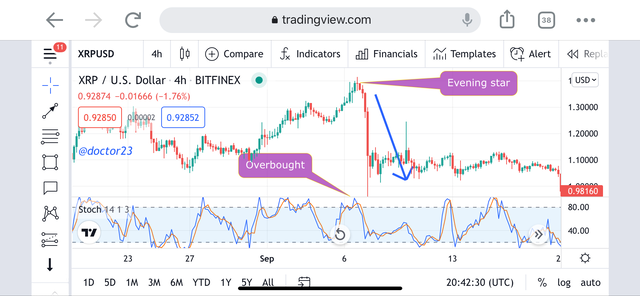
using indicators with price action
With price action, we can identify potential support and resistance zone, bullish and bearish wedges, rectangles and many others. I will be illustrating the appearance of an evening star and the confirmation from the stochastic indicator.
Divergence
Divergence is known to occur when the prices of an asset moves in opposite direction in regard to the technical indicator.
We normally have two types of divergence which are the bullish and bearish divergence. I will be illustrating below.
Normally we always have the market moving in a wavelike structure with the formation of higher highs and higher lows in the case of an uptrend or the formation of lower lows and lower highs in the case of an uptrend. It is then true that the technical indicator has to show this same pattern, when we have the technical indicator showing contrary to the price action, this signals a trend reversal and can be used to our advantage to make some pips.
For example, if we have the technical indicator forming lower highs and the price action showing lower lows; it indicates a bullish divergence which is a start of downtrend.
The Bullish and bearish divergence
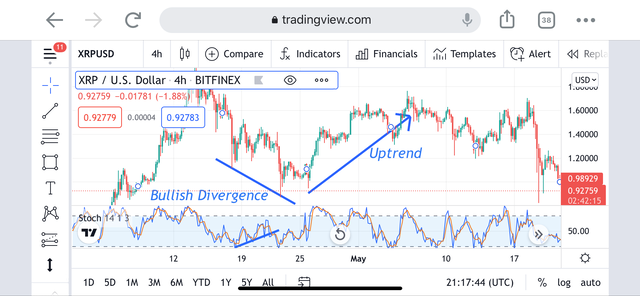
Bullish Divergence
The bullish divergence occurs when we have an indicator showing an uptrend with the formation of lower high with the action signaling a downtrend with lower low formation.
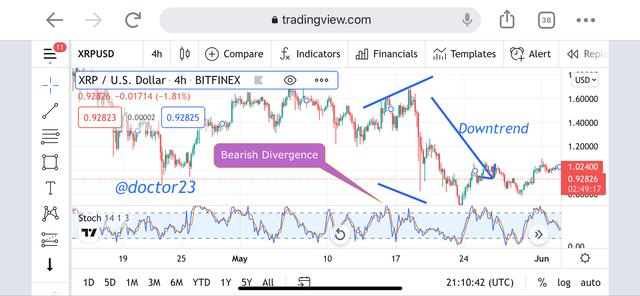
Bearish Divergence
The bearish divergence is the opposite of the bullish divergence. The bearish divergence. It occurs when the technical indicator shows a downtrend with the formation of higher lows while the price action shows an uptrend with higher lows formation.

Conclusion
So far, we have seen the leading and lagging indicators with their preferably usage in the ranging and trending markets respectively and example of the leading indicator being the Bollinger bands and ichimoko indicator and that of the lagging indicator.
We have also seen how to filter out false signals through the usage of price action and confluence. Also we have concluded with bullish and bearish divergence to indicate trend reversals.
Hello @doctor23 , I’m glad you participated in the 4th week Season 4 of the Beginner’s class at the Steemit Crypto Academy. Your grades in this task are as follows:
Recommendation / Feedback:
Thank you for participating in this homework task.
Thank you Sir