BNB/USDT Sell | S6T4 - Team Trading Post for Fredquantum-Kouba01 Traders Team


About BNB
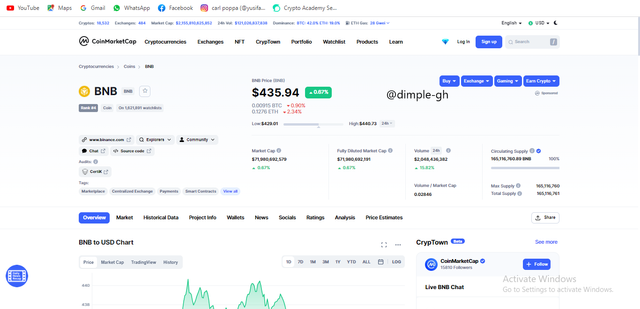
Binance growth and progress have made it the largest and most popular crypto exchange platform in the world.
Binance is recorded as the most valuable crypto exchange platform due to how secured and legitimate it has performed over the years. It has the largest trading volume as well.
Aside it been a centralized exchange platform, Binance has built its blockchain technology which is known as the Binance smart chain network. This is one of the most used blockchains currently in the world. The smart chain has also performed effectively over the years. Very secured, highly scalable, and charges low transaction fees as well.
Just like other blockchain platforms, Binance has its native token to be the BNB token. This token was initially built to be used as transaction fees on the Binance ecosystem. Due to how the project dominates, the token has attracted many huge investors to invest in the project.
Price data of BNB
Technical analysis about BNB
I would make technical analyses on both longer and shorter timeframes. It is always advisable to make a complete analysis before you enter into trade.
Analysis with 1-day timeframe
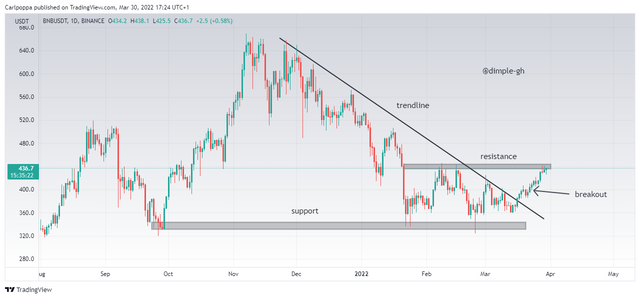
According to the 1- day timeframe chart above, the whole market was in bearish trend momentum. The market was producing a series of lower lows and lower highs.
However, the price reached a strong support level and the price started to retrace. After the price retraced for a while, the price reversed back to the bearish trend again but this time, the price failed to break the previous lower low which means that, the price has formed a double bottom.
From our knowledge of trading, the double bottom is a signal of a bullish trend reversal. And to our amazement, the price has successfully broken above the trendline which means the reversal is valid.
Here, we know our whole market momentum is bullish and henceforth we identify buy signals since we don’t want to trade against the trend.
Analysis with 4-hour timeframe
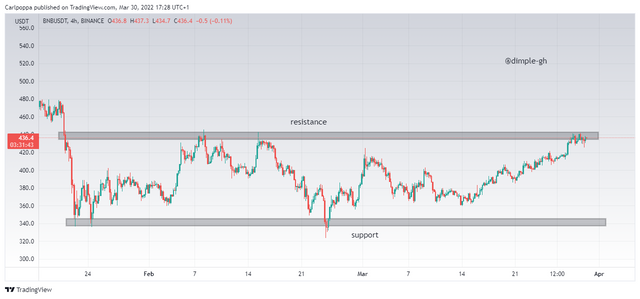
According to the 4-hour timeframe, the price of the BNB is currently ranging or accumulating. With this kind of chart, the key levels to identify are the support and resistance levels where the trading pressures (buying and selling pressures) are accumulated.
From the chart above, the price of the BNB is currently around the resistance area which indicates a sell signal. But the 1-day timeframe clearly shows a bullish signal which means, we should be very cautious if we are taking selling opportunities. The price could easily break above the resistance level due to the current state of the market.
Although pure technical would suggest a selling opportunity, it’s advisable to allow the market to play around to see the price behavior before we enter into trades.
Analysis with 1-hour timeframe
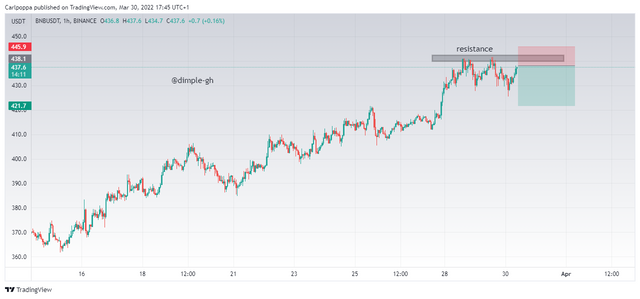
Here, we trade with a very simple and very efficient set-up.
According to the 1-day timeframe in the first chart, the price has met a resistance level which means although the strong momentum is bullish, there would be a retracing before the bullish run continues.
The 4-hour timeframes also signify that the price is at a resistance level. Which suggests a bearish movement.
Looking at the 1-hour chart, the price has currently reached the apex of the trend this means that there should be some rejection by the resistance.
Double top is also formed on the chart which also confirms the presence of a bearish movement.
With the above information, we can enter a scalp sell on the BNB.
we place a stop loss just above the resistance level or the double top and place a reasonable take profit with reliable risk management.
Technical indicators seem to produce some late confirms which in my opinion is not reliable.
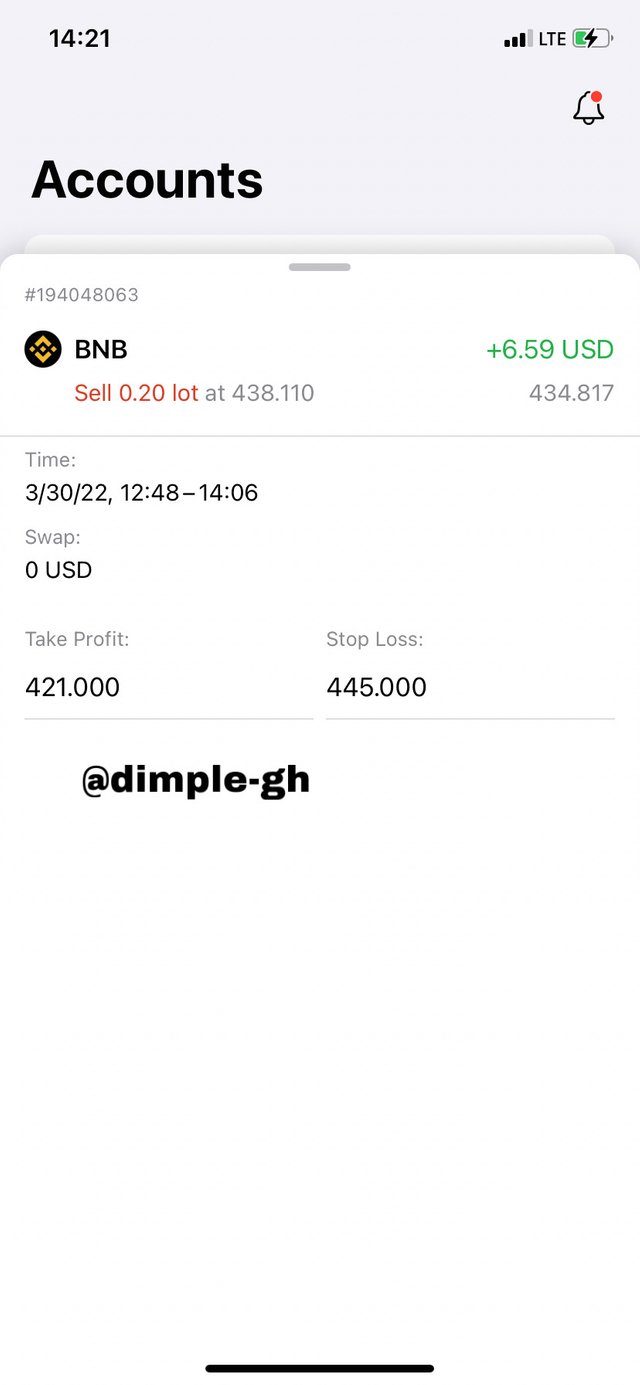
Trade placed in my Exness broker account
Conclusion
Today, I made some good profits. I closed the trade as some few pips profits this is because I used good risk management. Talking from price movements, I could have made more profits if I had waited for take-profit.
However, the price could have retraced back to probably stop loss. That’s why is very good to take partial profits when necessary.