Crypto Academy /S5W1-Homework Post for kouba01
It is my pleasure participating in the season 5 cryptoacademy. Prof @kouba01 has begun this season with an exceptional lecture, meaning that this season is gonna be an exceptional season.

Atr Indicator and How to Calculate ATR
Average True Range (ATR) indicator is simply an indicator that measures the rapid and unpredictable movement of the price of commodities in the market. This unpredictable movement is in one word referred to as Volatility.
This indicator was developed by a professional technical analyst known as J. Welles Wilder Jr. and was introduced in 1978. The ideal intent of this indicator was to provide a trader with some predetermined numerical values which aid the trader to determine the intensity of the volatility of an underlying commodity.
An important thing to note is that the ATR indicator is not a momentum indicator but it is purely dedicated in measuring volatility in the market.
Another important thing to note is that this indicator doesn't always move in the same direction as the market trend. There are times when there is a strong downtrend but the ATR indicator goes up.
How the indicator works is that whenever there is high volatility in the market, the indicator increases and when there is less volatility in the market, the ATR indicator decreases.

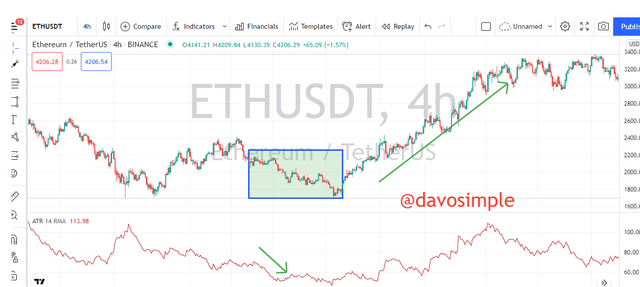
Here is a practical example of the above explanation. From the screenshot of ETHUSDT above, you can how the ATR indicator increased as the market volatility of in the market was high.

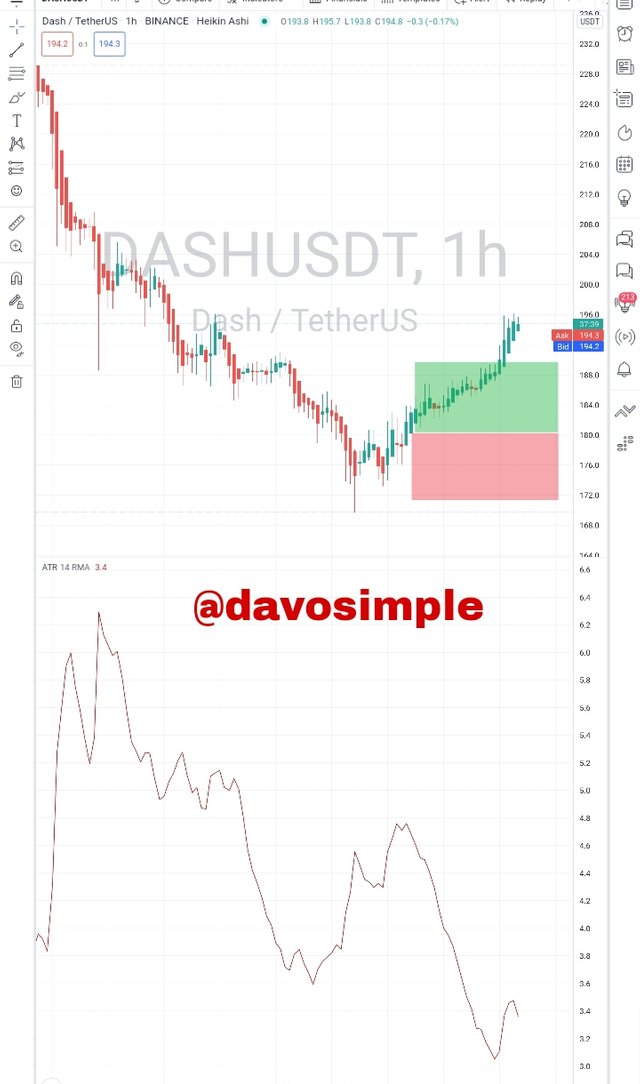
Here is another screenshot of DASHUSDT showing a decrease in ATR indicator as a result of low volatility in the market at that time was relatively low.
How to Calculate ATR Indicator
Calculations are done with the ATR indicator using either of three methods;
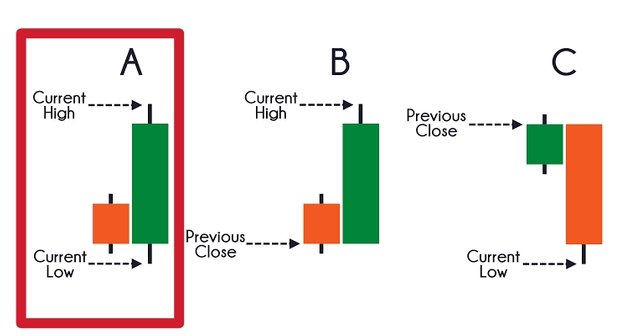
- Current high minus or less the current low is the first method and it is ideally used if formation of the chart is a bullish engulfing pattern. See screenshot below
Source
If the bullish engulfing pattern is formed, the current low will be subtracted from the current high.
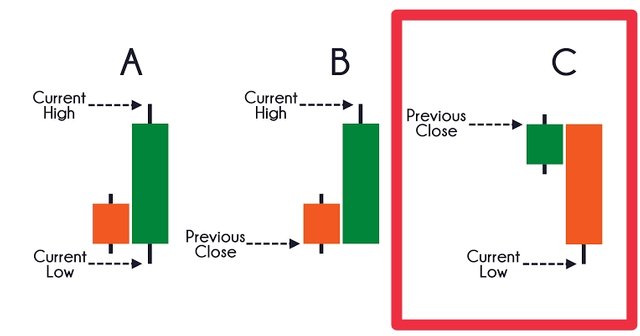
- Current low minus or less the previous close is the next method and it is ideally used if there is a bearish engulfing pattern on the chart. See screenshot below
Source
If this candles is formed on the chart, then the previous close will be subtracted from the current low
Source
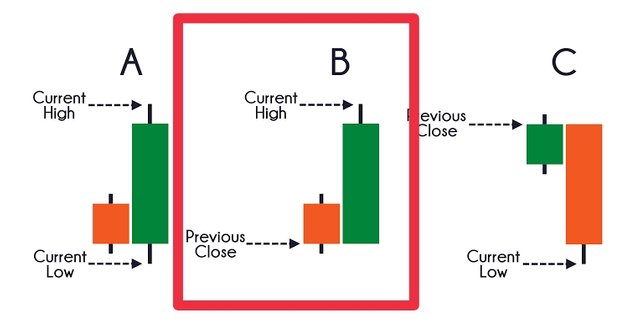
- Current high minus or less the previous close
Calculation of ATR
To Calculate ATR, the formula below is which was given in the class by Prof @kouba01 is what I will use.
ATR = max [(current high - current low), abs(current high - previous close), abs(Current low - Previous close)] / 14
When the value of the ATR is gotten, the proceeding ATR can be gotten using the formula below
Current ATR = [(Prior ATR x (n-1)) + Current TR] / n
Where n = The number of periods on the ATR indicator.

From the chat above, the candle indicated with yellow arrow,
Current high = 240
Current low = 230
Previous close = 237
Current high - Current low = 240 - 230 = 10
Current high - Previous close = 240 - 237 = 3
Current low - Previous close = 230 - 237 = -7
Average ATR = 10 + 3 + (-7) = 6
True range = Current high - Current low
= 240 - 230 = 10
Current ATR = [6 x (14 - 1) + 10]/14
Current ATR = 88/14 = 6.3

ATR Best Settings
By default, the ATR indicator is configured to cover the volatility of the last 14 periods which is 14 days.
I would not say that ATR has any best settings because if it is configured to be lower than 14 periods, it tends to measure the market volatility very fast because the number of periods the ATR has to cover and bring up the volatility result is small.
But if the ATR indicator is configured to be above 14 in periods, then it means that the indicator has a whole lot of periods to cover and as such, it will not measure the market volatility really quick.
Since it is that the higher the number of periods, the slower the volatility measurement and the smaller the number of periods, the faster the volatility measurement, it therefore means that each trader has to know what is suitable for his or her trade but for myself, depending on how volatile the market is, I really prefer the 14 period configuration. But if it is the crypto market which is known to have a very high volatility, I would configure the periods to be lesser than 14.
Below are some screenshots showing the higher and lower number of periods the ATR indicator takes into cognizance to measure the market volatility.

From the screenshot above, I configured the ATR settings to a period of 6 which is relatively lower. The ATR indicator, because the number of periods involved here is small, the volatility measurement was really fast.
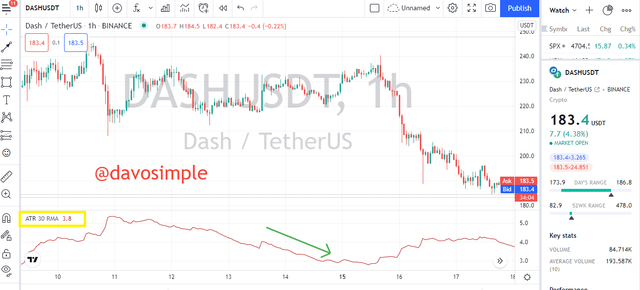
This is another screenshot where I configured the ATR indicator to a period 30. The ATR indicator, because the number of periods involved here is higher, the volatility measurement was relatively slow.
Reading of ATR indicator and Reading it With Other Tools
The ATR indicator reading is really a simple and concise one. Even though most traders mistake the indicator to be a momentum or an indicator that predicts direction of trend by thinking that when the indicator increases, it is an uptrend.
The ideal reading of the indicator is that when the ATR line increases or goes upward, it is an ideal indication that the current market is trending in a high volatility.
When the indicator line begin to decrease, the traders gets a confirmation that the market is in low volatility.
Combining ATR with Other Indicator
I have personally found this really useful and using it with the Heikin Ashi candles really works well for me.
The Heikin Ashi candles is a great trading tool in itself. It smoothens the chart to minimize a lot of noise by allowing the chart to maintain a particular flow when in a particular trend. For example if the price is in a strong uptrend, the Heikin Ashi candles will try to ensure that most or all of the candles remains green and when the market price is in a strong downtrend, most or all of the candles remains red.
For me, I allow the ATR indicator to have the default period configuration which is 14 periods. On the ATR indicator, the ATR line has made some highs and lows so I would pick one of the lowest point, atleast one of the lowest point that is low enough and then I take note of the ATR value at that relative low point. Then I will wait for the current ATR line movement to drop down to the relatively low point I chosed.
Below is a more clear example of what I mean.
On the chart of ETHUSDT, on a 4h timeframe, I picked a relatively low point. I will wait for the ATR value to drop to the point which I referenced as my relative low value.
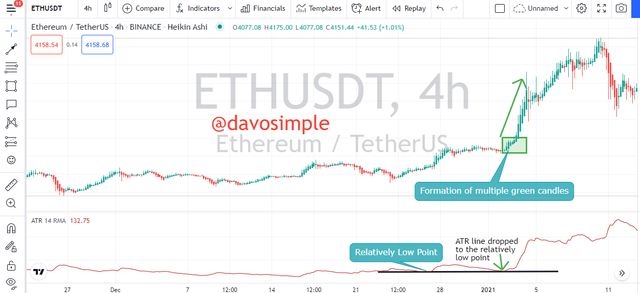
When the ATR line dropped to the relatively low value I choosed and wants to go back up again and the Heikin Ashin shows me multiple green candles, it is an indication that the breakout is possibly going to happen in the uptrend direction, and it is exactly what happened. This trade would have been a great profitable trade for me.

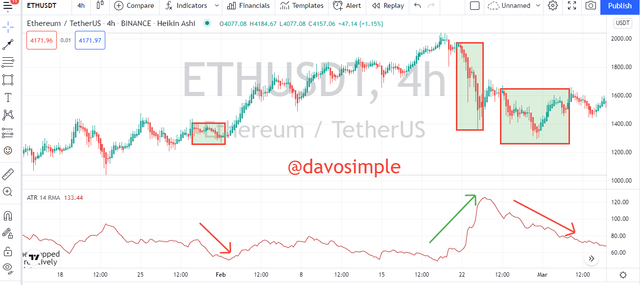
When the ATR line dropped to the relatively low value I choosed and wants to go back up again and the Heikin Ashin shows me multiple red candles, it is an indication that the break out is possibly going to occur in the downtrend and it is exactly what happened. This trade would have been a great profitable trade for me.
Using ATR to Determine Price Volatility and Price Dominance
ATR as Price Volatility Determinant
ATR indicator is known to be a concentrated volatility indicator. Whenever there is a high volatility in the market, the range of the candle stick will increase and the ATR line will also increase and whenever there is low volatility in the market, the range of the candle will reduce and the ATR line will likely reduce.
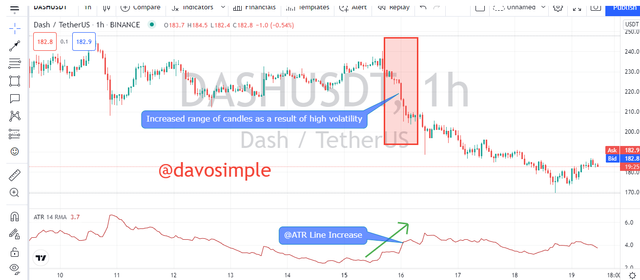
From the chart of ETHUSDT above, the range of the candle increased as a result of high volatility in the market. The ATR indicator followed suit by increasing so show how high the volatility in the market was. When the volatility was low, the range of the candles began to reduce and the ATR indicator also decreased.
Using ATR indicator as Dominant Force Determinant
As stated earlier, volatility in of price should follow suit the increase or decrease of the ATR line because the ATR line measures volatility. If this movement doesn't correlate, then it means there is a false signal which traders should be on the watch out for.

A clear look at this chart up here will give a deeper understanding of what I mean. We can see how price was making an upward movement but ATR was making a downward movement. This movement doesn't satisfy the ATR dominant force on the underlying volatility of the asset.
Even though the price is making a counter movement against the ATR indicator, traders need to be very careful at that point and probably let that very trade slide to avoid being trapped in a loss.
As a thumb rule, price should always follow or correspond to the increase or decrease of the ATR indicator to justify the volatility and dorminant force of the buyers and sellers in the market for a moderate trade to be executed.
ATR indicator as a Risk Management Tool in Trading
What makes a trader successful is the ability of the trader to understand what risk management is. Infact, risk management is most fundamental thing in trading because no matter how good a trader is with his sentimental analysis, fundamental analysis and technical analysis, without risk management, the trader will always swim in loss. The trader could make 5 straight winning trade but one single loss clears off the whole wins he made.
The ATR indicator has proven to be a great volatility measurement tool and as such, can help cushion some risks involved in trade giving a trader ideal points to place stop loss and take profits.
Every trader's intent in a trade is to make profit. And as such, placing stop loss anywhere is not professional.

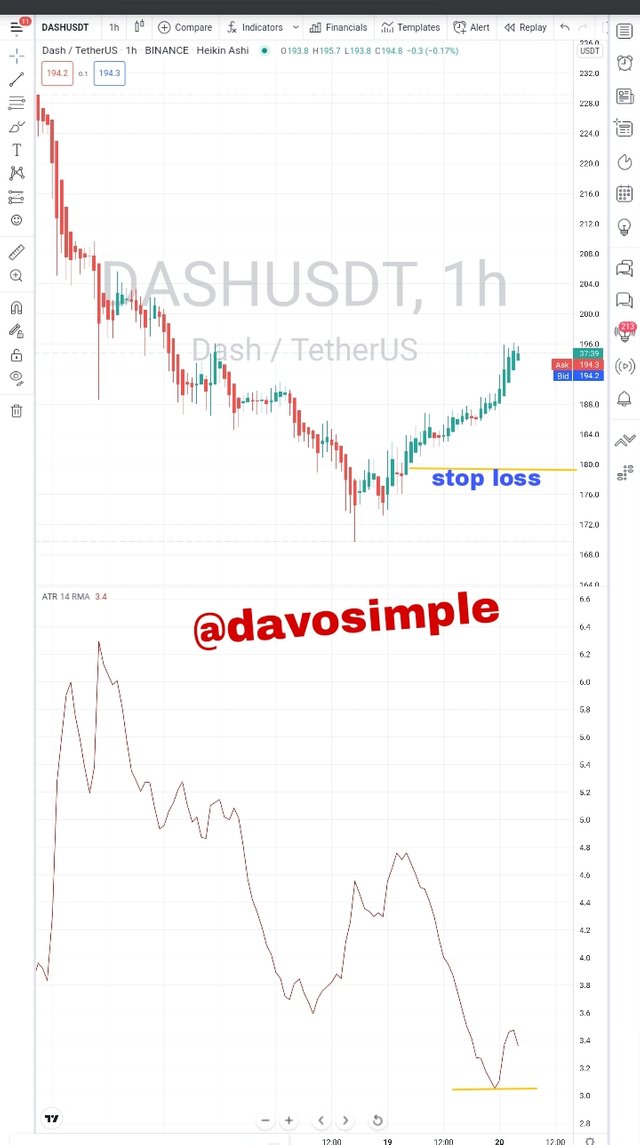
Take for example in this trade, the trader entered this trade, placed his stop loss at the point I have marked on the chart. And all of a sudden, the market hit the stop loss, closed the trade and then make a counter move.
Understanding the efficacy of the ATR indicator would have helped the trader to avoid this quick loss.
Depending on the market which is to be traded, if it is a high volatile market like the crypto market, then it ideal not to set stop loss at a position which is too close to the opening position.
To set stop loss using ATR is to first identify the market structure and then the stop loss should then be set base on the risk tolerance of the trader. By risk tolerance, I mean how conservative the trader is. But it is always ideal that the stop loss should be a multiple of the ATR.
Let's say from the chart above, I got an entry signal, perhaps to buy and the ATR value is 3, I should multiply the ATR value by 2 and then set my stop loss at 6 pips.
Alternatively, the formula for calculating stop loss points using ATR is;
Stop loss = Entry price +/- 3x ATR value.
So for this trade above, my entry point is 180 and the ATR point is 3.0
Stop loss = 180 - 3 × 3 = 171.
The stop loss should always be set to give the trade some breathing space so that if the market reverses, it won't hit the stop loss so quick.
To set my take profit, I will use the formula
Take Profit = Entry price +/- 3x ATR value.
Take Profit = 180 + 3 × 3 = 189
It gives me a 1:1 risk ratio which is considerably okay to go with.
Using ATR to Highlight Strength of Trends and Trend Reversal Signs
One of the fundamental beauty of the ATR indicator is that it helps a trader in spotting dynamic strength of trends by smoothing the market to give the intensity of the Volatility in the market.
An ideal increase in the ATR line depicts a very strong trend in the market and and ideal decrease of the ATR line suggests a very weak trend in the market.
Using ATR to To Spot Trend Reversal
Low ATR are likely formed when the market in consolidating or on sideways movement. At that point of extended sideways movement, the ATR line will likely be ranging very low and traders could really focus on when the ATR line will make peak move.
At that peak move, a trader who had added another useful directional indicator to his chart will know that the trend is right about to make a counter move to either the upward it the downward direction
Advantages and Disadvantages of ATR Indicator
Advantages of ATR Indicator
One of basic advantage of the ATR indicator is it's ease of understanding of how it works. This means both the beginner and the advanced trader can easily understand how the indicator works if good knowledge about the indicator is given.
The fundamental advantage of the indicator for me is it's ability to help traders in managing risk in their trade. Using this indicator help a trader make greater profits in their winning trades than the greater loss in their losing trades.
Most traders feel it is right to use the same trade setup in different markets which is wrong. But the ATR indicator helps the trader to know the weight of volatility in each market and then know how to modify their trade setups.
Even if this indicator doesn't give trend direction, it aids the trader to know optimum entry and exit points.
It doesn't have any principal limitations on lower or higher timeframes. It flows pretty smooth on both high and low time frames
It is a great tool in idenfying when trend is about to reverse.
Disadvantages of ATR Indicator
It measures only volatility in the market and doesn't indicate if the market is going be in the uptrend or the downtrend direction.
It has a way of misleading some amateur traders to open a buy trade when the ATR line increases when in reality the market is about to go bearish.
The indicator on its own cannot give perfect or true trade enteries, therefore it depends on other technical indicators for a successful trade to be achieved.
Conclusion
The financial market is a very profitable and at the same time, a very risky investment scheme due to the market volatility. But all thanks to J. Welles Wilder Jr. who created the ATR Indicator, a simple to use indicator which purely base on measuring the level of volatility in the market, thereby helping in cushioning the losing rate of most trades and serve as a Risk management tool to also fall back to before opening a trade.
Even though there are other great indicators, the ATR indicator has stand out to be one it's kind by unleashing tremendous benefits to traders with it's ease of use and understandability.
Special thanks to Prof @kouba01 for this great lecture. It is really and exceptional lecture for me. Stay blessed Prof.
N/B: Except otherwise stated, all images used in this homework post are screenshots from trading view
Hello @davosimple,
Thank you for participating in the 1st Week Crypto Course in its 5th season and for your efforts to complete the suggested tasks, you deserve a Total|7.5/10 rating, according to the following scale:
My review :
Good work in general in which the answers differed in their analysis and interpretation, and these are some notes.
A clear explanation of the ATR indicator, with a good example of how to calculate its value based on the chart.
It would have been possible to explain in more depth the difference between an increase or decrease in the value of a period and have clearly defined your personal choice.
Your answer to the third question was good.
You did not delve into your analyzes of how to manage trading risk, highlight the strength of the trend and identify any signs of change.
Thanks again for your effort, and we look forward to reading your next work.
Sincerely,@kouba01