Crypto Academy /S4W8-Homework Post for kouba01

I'm happy to participate in this last academy lecture of season 4 by Professor @kouba01, it's actually an exquisite tour so far to say. Best wishes as we engage in our Holiday and God bless everyone of us.
- In your own words, give an explanation of the ROC indicator with an example of how to calculate its value?And comment on the result obtained.
First of all ROC could be seen as the speed at which a variable or an asset changes over certain periods. Moreso, this is a momentum base indicator that measures the percentage change in the current price of an asset and some possible previous periods of the same asset in view.
This is plotted against the zero line with a confirmation of an uptrend if the indicator's position is above the zero line and a downtrend if the price is below or at the negative side of the indicator, although this is not always congruent as there may be times of divergent in the indicator or false signals which must be carefully filtered out possibly with the aid of some other indicators.
Procedure For Calculating ROC Indicator
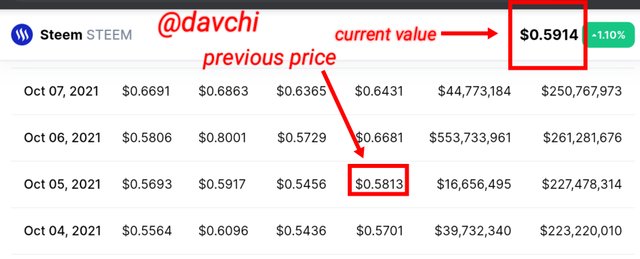
I will illustrate this using the value of steem in the past 21 periods dated October 5, 2021 and Steem closing price was stipulated at $0.5813.
Nevertheless, as at the time of writing this post being 26th October,2021 the price of steem is stipulated at $0.5914
It is believable that there are many formulas in calculating ROC but let's use the formula below which I got in the course of my research.
ROC = [(current price÷price of previous period)-1] x 100
ROC= [(0.5914/0.5813)-1] X 100
ROC=1.73748
.:.ROC=1.74% increase as approximated
Explanation Of The Result:
The results obtained from the calculation above indicates that steem has traded at the positive side of the indicator but not with a much-appreciated value as it only gained one percent increase from the calculated coefficients.
On the other hand, the trend has been on the bull since it was able to cross the zero line threshold but not with an encouraging momentum which could have boosted it to a better price variance as it minutely appreciated from $0.5914 to $0.5813 which is about 0.017% increase

2 Demonstrate how to add the indicator to the chart on a platform other than the tradingview, highlighting how to modify the settings of the period(best setting).(screenshot required)
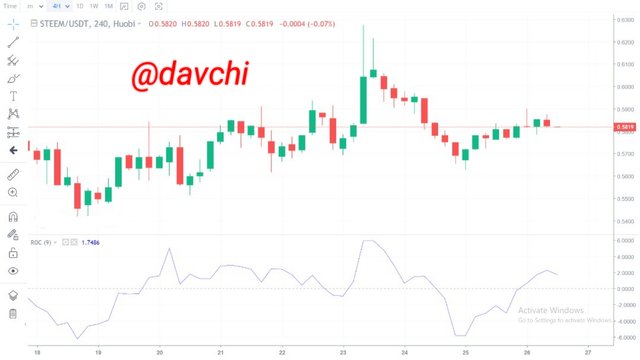
I'll be illustrating this using my Huobi trading account and a pair of STEEM/USDT below.
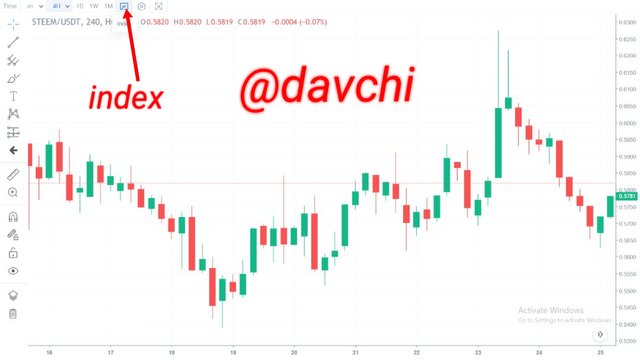
After logging into my trading account on Huobi, I click on the indicator icon at the top corner of the trading interface.
Next I type ROC on the search box and then click on it to get inserted into the STEEM/USDT chart.
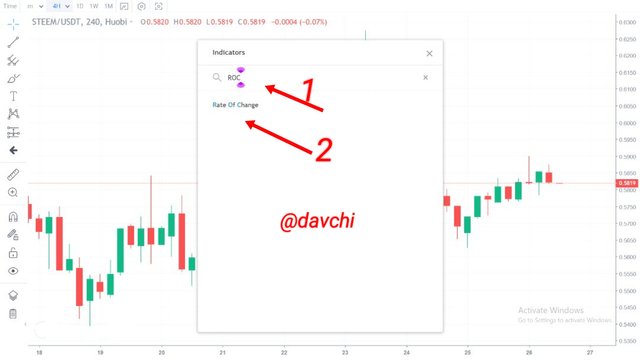
Huobi Exchange
After clicking on the indicator, it is automatically inserted into the chart and ready for use.
Next I click on settings, and based on its default mode this indicator has an input length of 9 periods which I'm leaving it at that range.
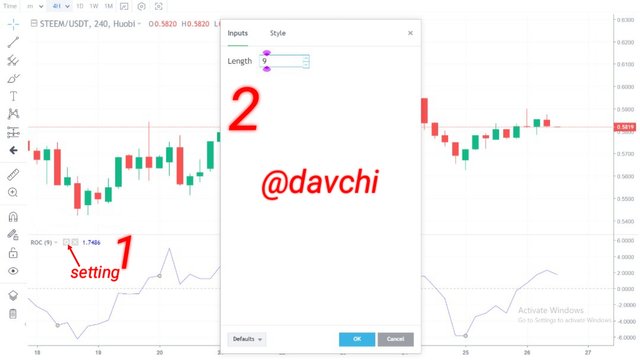
Huobi Exchange
In the style mood, it has a default setting in its precision menu with a zero line and a right sided positioning of the ROC scale as we can confirm this
below.
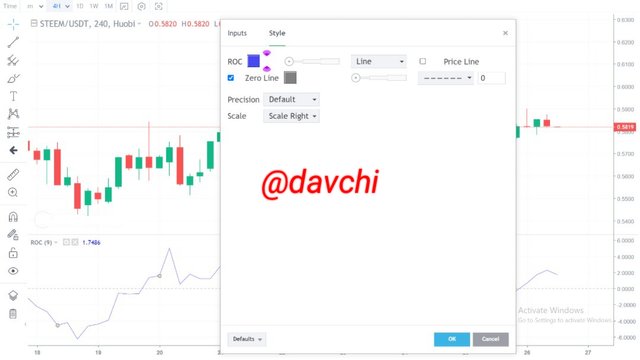
Huobi Exchange
Finally, on the modification of its setting, this indicator has a default setting of 9 periods with regards to its input length.
Nevertheless the best setting for this indicator is dependent upon the trader as everyone has his/her best time of trade.
A short term trader can go for 9 lengths, more or less while a long-term trader can go for a lengthier period which all depends on the trader's choice or length of time.

3 What is the ROC trend confirmation strategy? And what are the signals that detect a trend reversal? (Screenshot required)
I will be illustrating this in two dimensions first in a bullish trend and then in a bearish market.
- Trend Confirmation In A Bullish Market
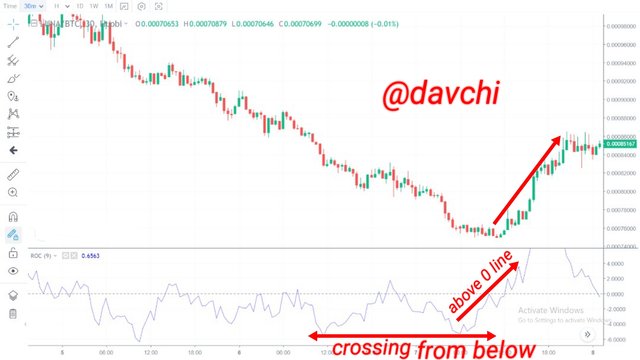
For a trend to be confirmed in a bullish market, the indicator must have crossed the zero line and then be making a very strong and continuous upward swing within the positive 3 and 4 horizontal axis; at this indication, it is an affirmation for a bull or an up-trend.
Using the LUNA/BTC chart above, we can confirm that there is a supportive momentum which drove this market above the zero line threshold, as confirmed in the indicator when it started taking a bull position across the horizontal zero line an affirmation for an uptrend.
- Trend Confirmation In A Bear Market
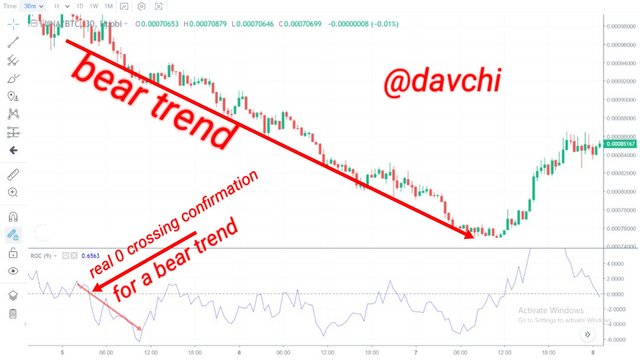
For a real trend to be confirmed in a bear market, the indicator must have crossed the zero line axis and then must be In a more trending deposition below the zero line axis.
From the LUNA/BTC chart above, a down trend is confirmed as the indicator makes a continuous downswing from above the zero level threshold and crossing it to the negative side of the indicator to confirm a real bear market position even as confirmed in the chart after the market has hit its resistance level, it now swings to a real bear trend.
- Beer Reversal
First we must confirm that the market price chart has been in a bull trend and that the indication has been above the zero line axis.
Further, the indicator must start making a weak trend which shows that the bull trend is actually coming to it's elapsing period, then the trend starts reversing into a beer market which also must be confirmed in the indicator as it starts approaching or crossing the zero line threshold.
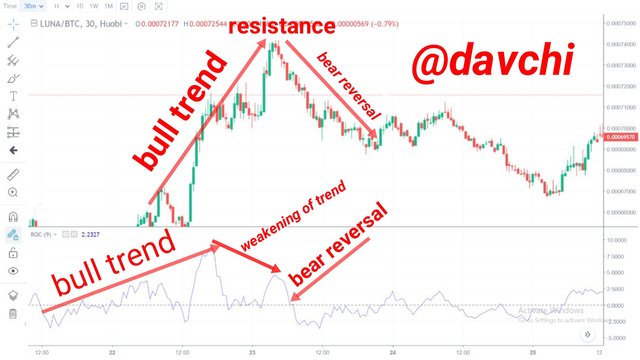
From the screenshot of LUNA/BTC above we can confirm a bear reversal as the price chart that has kept on the bull could no longer proceed due to the point of resistance hit by the price at about 0.000746 LUNA to BTC price. Further this was confirmed in the indicator as the line kept approaching the beer trend after a bull position that kept weakening as it dived below the zero line to confirm a Bear reversal from a bull trend.
- Bull Reversal
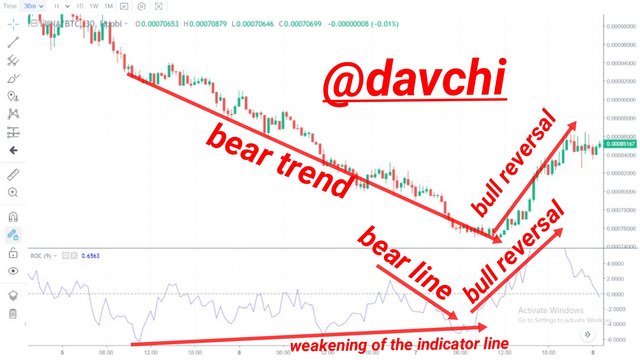
In a bull market therefore, reversals are indicated at periods where the market has been in a beer trend, then it must be taking a weak beer position and at this period, the momentum gathered by the indicator now compels it to start swinging upwards to confirm it's bull reversal from a beer market.
In the LUNA/BTC screenshot above, we can confirm a Bullish reversal from the indicator as the line kept a momentum swing against the negative area of the indicator until it was able to break the zero line threshold in a stronger momentum which now kept it above the negative side of the indicator as confirmed in the price chart as it takes a true bull position against it's previous bear trend after hitting the support level.

4 What is the indicator’s role in determining buy and sell decisions and identifying signals of overbought and oversold؟(screenshot required)
First we must bear in mind the eminence of the zero line and its significance when the indicator line crosses below or above it.
On the other hand, I wish to specify the overbought and oversold region in the screenshots provided below simultaneously with the ROC role in determining buy and sell positions.
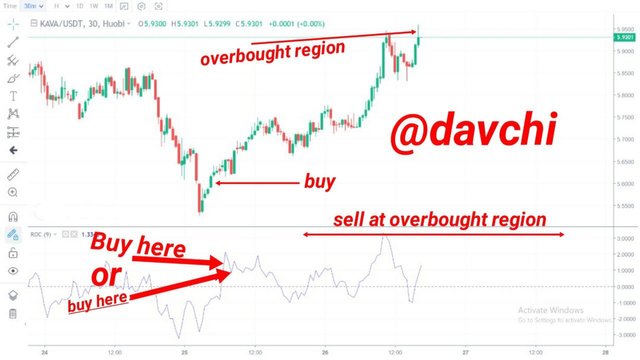
- The Indicators Role In Determining A Buy Position And a Simultaneous Identification of Overbought Region.
Now in a buy position we have to confirm that the indicator line has taken a momentum swing above the zero line from the negative area of the indicator box and is now in the positive side.
Next we have to wait for a slowdown of the indicator line and then if this is confirmed we have to enter for a buy order which must be in consonance with the price trend.
Next, the trend has to make an obvious high trend where a trader may also confirm to be the resistance point and the indicator on the other hand now starts making a lower high level after its previous high point, this signifies an overbought region were an asset in view is overvalued at this position therefore, it is a notification for a sell order.
From the KAVA/USDT chart above, we can confirm that the indicator started making a very strong swing from the negative side of the indicator area.
After crossing the zero line, it made a bit of relaxation, that is, there was a little slow down from the indicator trend. At this observation, a trader can enter a buy order although he can enter prior to this point as he may also have entered immediately after the strong swing above the zero line from the negative side of the indicator as I also indicated.
Next when the indicator has made a very high position and possibly start slowing down, that is when it starts making a lower mounts from its previous high position, this is an indication that the asset in view for instance the kava price in view is overvalued and it is wise to sell it off against price depreciation.
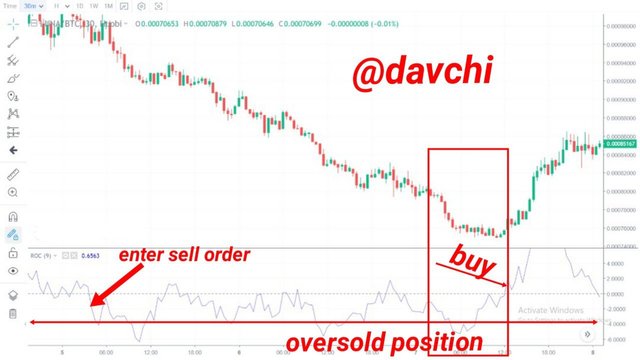
- The Indicators Role In Determining A Sell Position And a Simultaneous Identification of Oversold Region.
To confirm a sell position, the indicator must have been above the zero line that is at the positive area of the indicator box and then be making a very strong momentum swing in a down position below the zero line. After a strong swing below the zero line, we have to wait for a slowdown after the crossing of the zero line by the indicator then when this is confirmed, it is an affirmation for a sell order.
On the other hand, the oversold region is identified when the indicator has gone below the -3, -4 or possibly below this axis. At this confirmation, we can affirm the reversal in the indicator to ensure a bull trend in the price chart and at this point a trader can still re-enter the market after exiting or selling his asset.
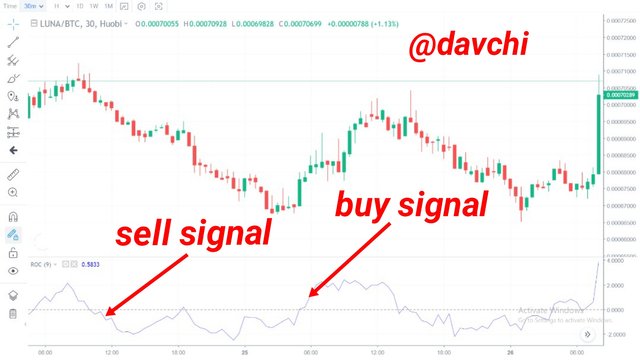
From the LUNA/BTC chart above, a sell position can be entered at the downward strong swing position made by the indicator across the zero line axis after a bit relaxation of the indicator line.
The oversold region which is a position within the -3 and below axis made by the indicator is an indication that there will be a price reversal but this is contingent upon the trend position at the moment.
So as the indicator starts making an upwards movement and low mounts from the previous lower mounts, it is an affirmation of another bull market even as we can confirm from the screenshot above so a trader can re-enter the market again after a confirmation of an elapsed oversold period.

5 How to trade with divergence between the ROC and the price line? Does this trading strategy produce false signals?(screenshot required)
I will by explaining this in two ways first is how to trade the ROC in a bullish divergence and then in a bearish divergence as this is a normal thing with indicators which must be looked into or traded with proper carefulness.
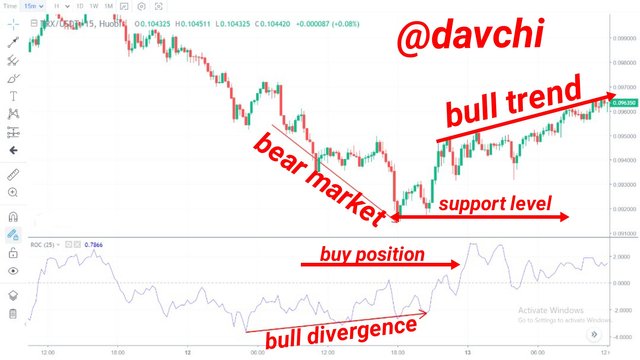
- Trading The ROC In A Bullish Divergence
Bullish divergence occurs when the indicator swings up in a higher position than its previous heights across the zero line line while the price chart keeps on the beer.
When this happens, it is mostly affirmed to be followed with an up-trend in the price chart, that is if it is a true bull divergence.
Finally if this trend is spotted between the price chart and the indicator it is advisable for a trader to wait until the indicator has gathered momentum enough to swing above the zero line threshold and then this is actually an opportunity for a buy order.
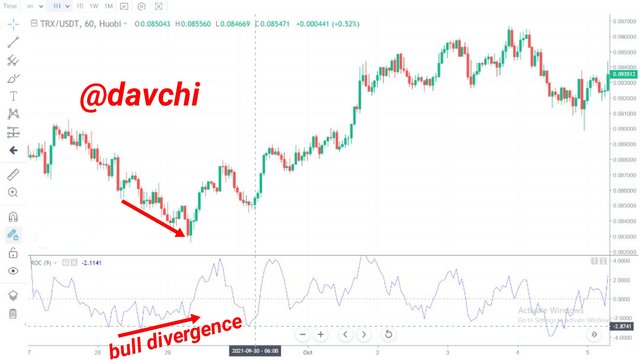
Using the TRX/USDT chart above, we can confirm a bull divergence as the indicator keeps an upwards position while the price chart is in the bear.
Finally a trader can enter for a buy order after the price has hit its support level and the indicator has swinged across the zero line to confirm a bull market in this regard, which is also confirmed in the screenshot above.
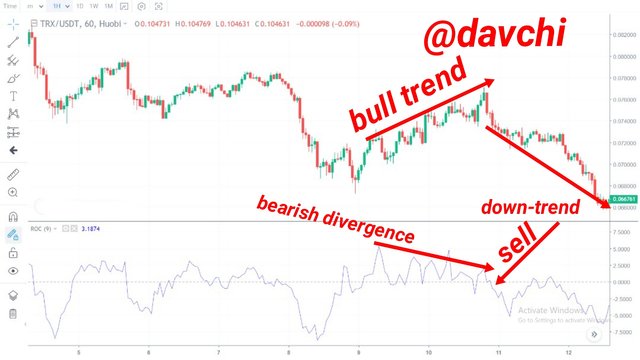
- Trading The Roc In A Beer Divergence
This also occurs in a beer divergence as the indicator keeps making low positions from a higher mount while the price chart keeps on the bull.
This swing in the indicator is a confirmation of a near bear market which the trader had to pay attention to before either entering a bear or a bull market against trade loss as this may not always be true without the aid of some other indicators like the RSI,MA, EMA, MACD etc.
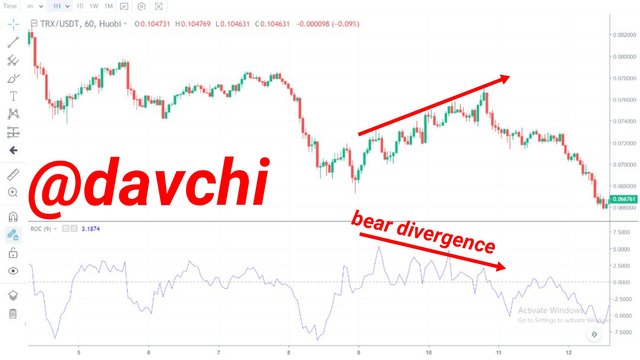
Confirming the divergence scenario in the TRX/USDT screenshot above, it is observable that the indicator has been on a bear divergence while the price chart was on the bull trend.
At the elapsing of the divergence period there was a subsequent down trend in the price chart which is a confirmation for a bear market and a sell order entry as I indicated above where the market has crossed the zero line and was confirmed by the trend for a bear market, so with this illustration is actually how to manipulate the divergence issue in a bear scenario.
Finally this trading strategy can produce false signals without the assistance of some other indicators like the EMA, RSI, MACD etc.
Trading with this strategy involves a high level of risk as this is not a consistent trend to trade with and if not properly managed can lead to loss of trade.

6 How to Identify and Confirm Breakouts using ROC indicator?(screenshot required)
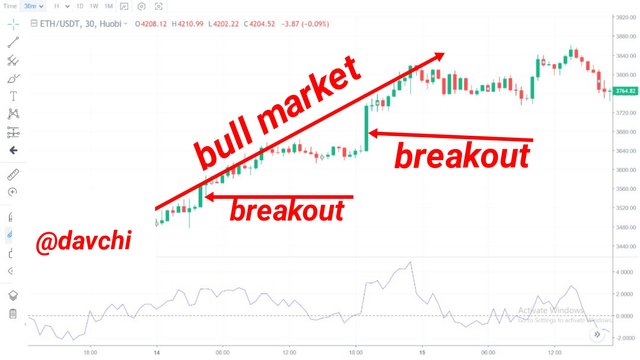
Breakouts are normal scenarios seen in everyday crypto. This occurs as a result of strong price momentum against the normal price movement in a trend.
This can occur either in a market with low volatility, a bull or a bea scenario.
I will be using screenshots to illustrate the different breakout scenarios in different markets below.
- Low Volatility Market Breakout.
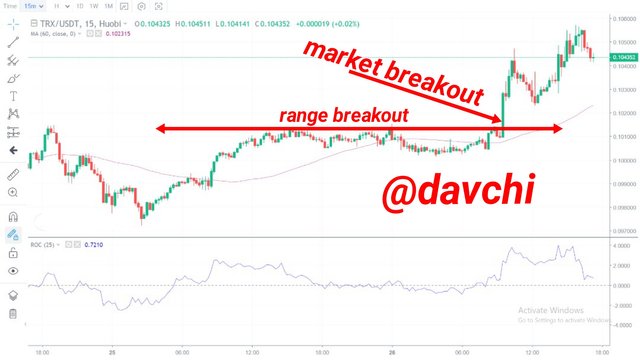
This is a low volatile market breakout, at this point, the indicator makes a rally within the zero line of the indicator until there is a confirmed breakout to indicate the possible trend of the market and here the TRX/USDT market broke out to the bull trend at $0.101 as is obvious in the chart above.
- Breakout In A Bull Trend
This is a bull market breakout where the ETH/USDT market, while in an up-trend, took a lengthier chart against it's normal candle line to spot a breakout within its price movement which is confirmed by a more positive side movement in the indicator.
- Breakout In A Bear Market
Huobi Exchange
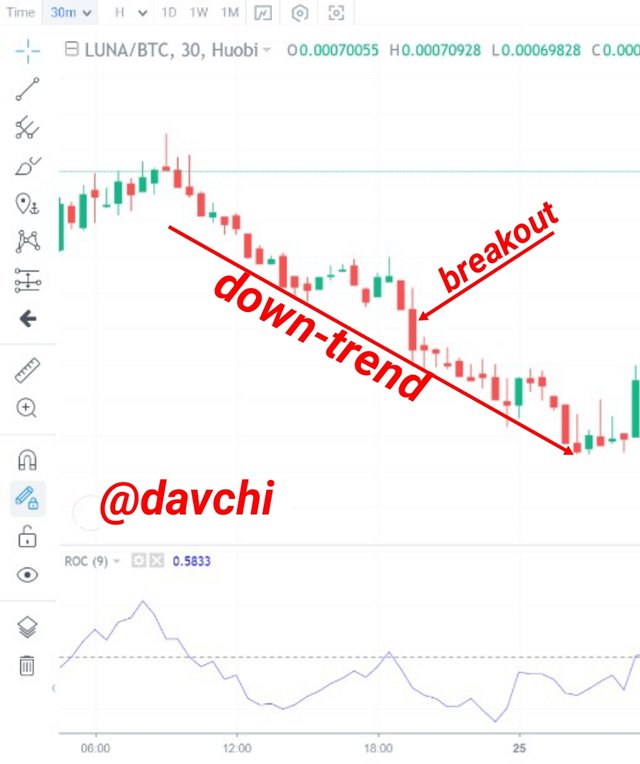
This is a bear market breakout of LUNA/USDT where the market trend took a strange chart against it's normal candle chart in a down-trend.
This is also confirmed by a more negative side movement in the indicator.

7 Review the chart of any crypto pair and present the various signals given by ROC trading strategy. (Screenshot required)
- Buy And Sell Signal Using LUNA/BTC
- Bull Divergence Signal Of TRX/USDT
- Bear Divergence Signal of TRX/USDT

CONCLUSION
The ROC Indicator is actually an exquisite indicator that shows the rate of change within a specific period of trade in a chart.
Despite being an indicator that spots the variances in specific periods of an asset, it also has the capacity to annotate periods of entry and exit from the market and many other functions.
Nevertheless, despite it's magnanimous advantages, it is also wise to use it simultaneously with some other indicators like RSI, EMA, MACD etc as to avert irrequisiteisite trade losses as no indicator is an island of expediency and buoyancy on its own. Thanks for going through.
Finally all the chart screenshots were taken from Huobi Exchange and also edited by me.
Congratulations! Your post has been selected as a daily Steemit truffle! It is listed on rank 20 of all contributions awarded today. You can find the TOP DAILY TRUFFLE PICKS HERE.
I upvoted your contribution because to my mind your post is at least 12 SBD worth and should receive 31 votes. It's now up to the lovely Steemit community to make this come true.
I am
TrufflePig, an Artificial Intelligence Bot that helps minnows and content curators using Machine Learning. If you are curious how I select content, you can find an explanation here!Have a nice day and sincerely yours,

TrufflePigHello @davchi,
Thank you for participating in the 8th Week Crypto Course in its 4th season and for your efforts to complete the suggested tasks, you deserve a Total|6.5/10 rating, according to the following scale:
My review :
Work with acceptable content. It was possible to go deeper into the ideas presented and provide several examples. Here are some notes that I bring to you.
A good explanation of the ROC indicator and especially how to calculate its value with a good existing example.
You have not deepened your analysis to interpret the best parameters of the chosen period option.
A detailed explanation for trend determination and its reversal.
A superficial answer to the last question.
Thanks again for your effort, and we look forward to reading your next work.
Sincerely,@kouba01