[2017-DEC] Xperi Coporation $XPER Correlation Histogram
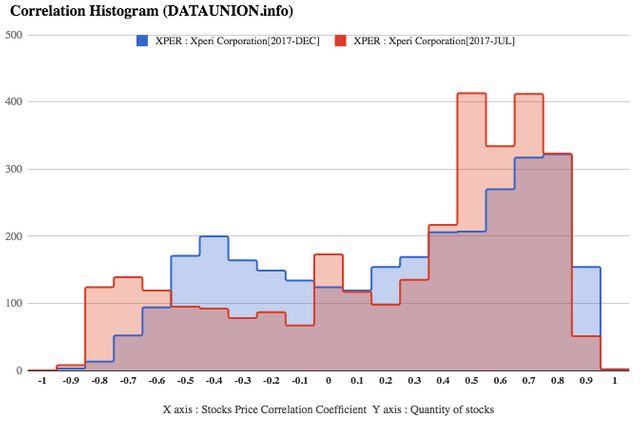
X axis : Stocks Price Correlation Coefficient
Y axis : Quantity of stocks
1,000 Day Parameter
3,025 NASDAQ Stocks Price
Correlation Histogram Type Description
Zero Correlation Histogram
The stock pair is concentrated in the correlation coefficient zero.
Case the diversification, Zero type will Overweight of the portfolio.
And, Zero type are often low volatility.
Type A Correlation Histogram
The stock pair is concentrated in the plus high correlation coefficient and minus high correlation coefficient.
The A type will underweight of the portfolio.
This is not a normal distribution.
Type B Correlation Histogram
The stock pair is concentrated in the plus high correlation coefficient.
The B type will underweight of the portfolio.
This is not a normal distribution.
Type C Correlation Histogram
The stock pair is concentrated in the minus high correlation coefficient.
The C type will underweight of the portfolio.
This is not a normal distribution.
Information is provided "as is" and solely for informational purposes, not for trading purposes or advice, and may be delayed.
Information provided by the investment decisions are not legally responsible for. In addition, the information posted can not be distributed without permission.