Crypto Academy / Season 3 / Week 7- Homework Post for [@kouba01] | Trading Crypto With Average Directional Index (ADX) Indicator
Hello Professor @kouba01, I'm privileged to learn this much about the ADX indicator from you. It's my first time hearing of it though. I got into crypto not long ago so most of these indicators are new to me. In the long run, your lecture was interesting and so I decided to partake in your homework task. I hope to like it.

- Discuss your understanding of the ADX indicator and how it is calculated? Give an example of a calculation. (Screenshot required)
ADX Indicator

ADX means Average Directional Movement Index. It is a technical analysis indicator designed by Welles Wilder as part of the Directional Movement System. Its main purpose is to tell the strength of a trend whether it is an uptrend or a downtrend.
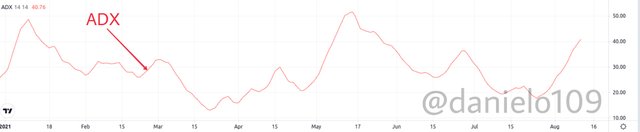
The ADX indicator ranges from 0-100. It's a simple curve that can be used to easily tell the strength with the range of its value. If it is within the range of:
- 0-25: the trend is weak or there is no trend.
- 25-50: there is a trend in the market.
- 50-75: there is a very strong trend.
- 75-100: the trend is extremely strong.
With this range of values, you can easily tell the strength of a trend and strategize your trades accordingly. Note that the 25 value mark is very important. This signifies an existent of a trend when the ADX exceeds it which could be a signal to a breakout.
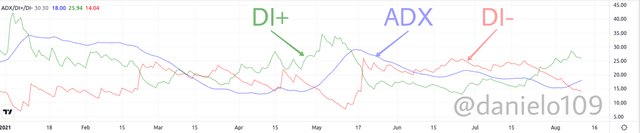
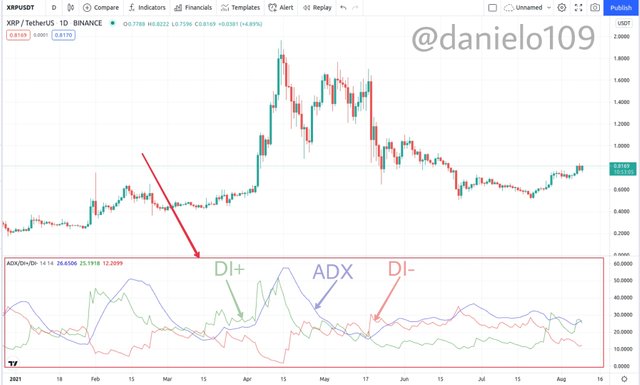
ADX is mostly used with DI+ and DI- indicators. The ADX, DI+ and DI- are components of the Directional Movement Index (DMI). The DI+ and DI- help in telling the direction of the trend. Below is an image of the ADX, DI+ and DI-.
How is ADX calculated?
ADX is calculation is quite complex. You have to do a sequence of calculations using the formulae below. This includes the DI+ and DI- lines.
+DI=[(Smoothed +DM)/ATR]×100
-DI=[(Smoothed -DM)/ATR]×100
TR=Max (|PH - PB|; |PH - C|; |PB - C|)
DX=[(∣+DI−-DI∣)/(∣+DI+-DI∣)]×100
ADX= [(Prior ADX×(n-1))+Current ADX]/nwhere:
+DM (Directional Movement)=Current High−Previous High
-DM=Previous Low−Current Low
Smoothed +/-DM=∑ nt=1 DM−(∑ nt=1 DM/ n) + CDM
CDM=Current DM
C= The price of the day, PB= Lowest price of the day and PH= Highest price of the day
ATR=Average True Range
Let's take an example of the calculation of ADX.
- You first calculate DM+, DM- and the true range (TR) for each period n.
- Smooth the n-period averages of DM+, DM- and TR
- Divide the smoothed DM+ by the smoothed TR and multiply by 100 to get DI+.
- Divide the smoothed DM- by the smoothed TR and multiply by 100 to get DI-.
- Now we find DMI which is DI+ minus DI-, divided by the absolute value of the sum of all DI+ and DI- multiplied by 100.
- Now solve for the DX values for at least n periods and smooth the results to get ADX.
- First ADX = sum n-periods of DX/n
- After the first ADX, ADX= [(prior ADX × (n-1)) + current DX]/n
As you can see the calculation is quite complex. There are simpler calculations that do not involve the processes above. You can have more information about the calculation above here
A simpler calculation can be done with the steps below.
I'm going to use STEEM/USD pair
Current high= 0.5589 | Previous high=0.5385
Current low= 0.5235 | Previous low=0.5172
Previous day close= 0.5342
SMA 14= 0.5611 (from chart)
EMA 14= 0.5609 (from chart)
First step
For TR, calculate the:
First price difference= High - Low = 0.5589 - 0.5235= 0.0354
Second price difference= High - Previous close= 0.5589 -0.5342= 0.0247
Third price difference=Previous close - current low= 0.5342 -0.5235= 0.0107
And take the greatest value among the differences which is 0.0354. Therefore TR = 0.0354
Next Step
Solve for ATR. TR= 0.0354 and SMA 14= 0.5611
ATR 14= SMA 14 × TR= 0.5611 × 0.0354= 0.01986294
Step 3
Solve for DM+ and DM-
DM+ = Current high - Previous high= 0.5589- 0.5385= 0.0204
DM- = Previous low - Current low= 0.5172- 0.5235= -0.0063
Step 4
Solve for DI+ and DI-
+DI 14= [(EMA 14(DM+))/ATR 14] = [(0.5609×0.0204)/0.01986294]× 100= 57.6065779
-DI 14= [(EMA 14(DM-))/ATR 14]= [(0.5609×(-0.0063))/0.01986294]× 100= -1.7790267
Step 5
Solve for DX
DX 14=[(∣+DI−-DI∣)/(∣+DI+-DI∣)]×100= [|(57.6065779 - (-1.7790267)) | /(|57.6065779+ (-1.7790267|)] ×100= 106.373293
Step 6
Solve for ADX 14
Prior ADX=14.6154
ADX 14=[(Prior ADX 14× 13) + DX 14]×100= [(14.6154× 13)+106.373293]×100= 29,637.3493
Therefore, the ADX= 29,637.3493
2.How to add ADX, DI+ and DI- indicators to the chart, what are its best settings? And why? (Screenshot required)
Adding ADX, DI+ and DI- Indicators to the Chart
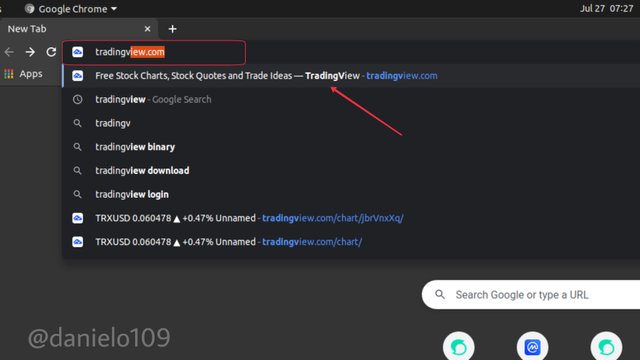
Would be using TradingView for this demonstration.
- Firstly, go to https://tradingview.com.
- Click the Search Markets Here. Enter and select the asset pair you want to view.

- Click on fxindicators.
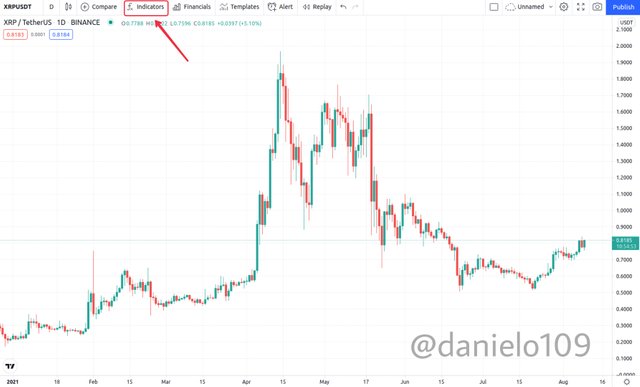
- Input "average direct..." and select Average Directional Index with DI + and DI-.
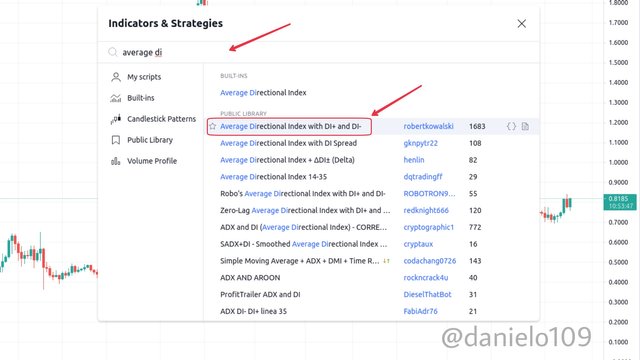
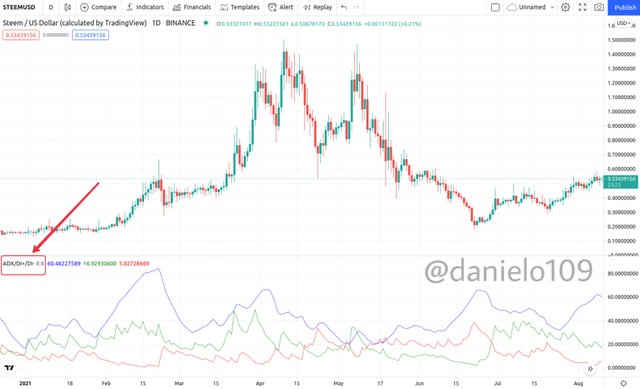
- The ADX indicator would be added to the chart as shown below.
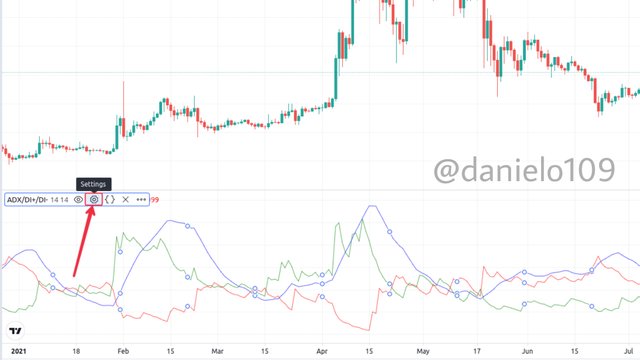
How to configure the ADX with DI+ and DI-
To configure the indicator, move your pointer to the top left corner of the indicator. A horizontal bar would open when you point on ADX/DI+/DI-. You can click on any of the curves of the indicator to open the bar. Next, click on the settings icon.
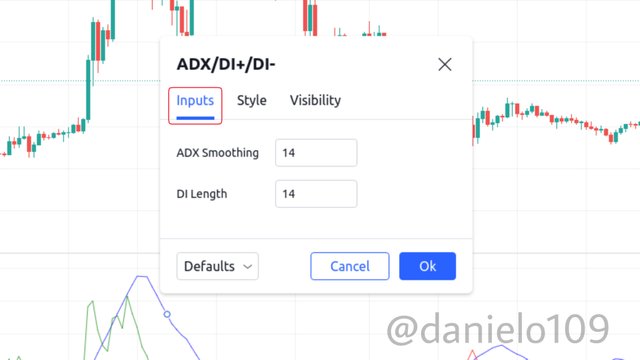
At the settings, there are three sections. Inputs, Style and VIsibility.
- At the inputs section, you can input your preferred values for the ADS Smoothing and DI Length. By default, they are both 14.
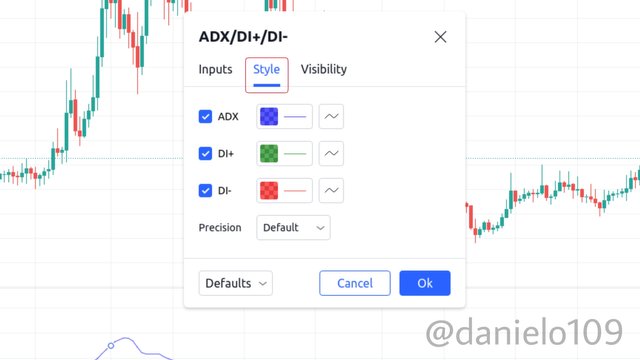
- At the style section, you can change the colours of the ADX, DI+ and DI- lines. Set the precision to default.
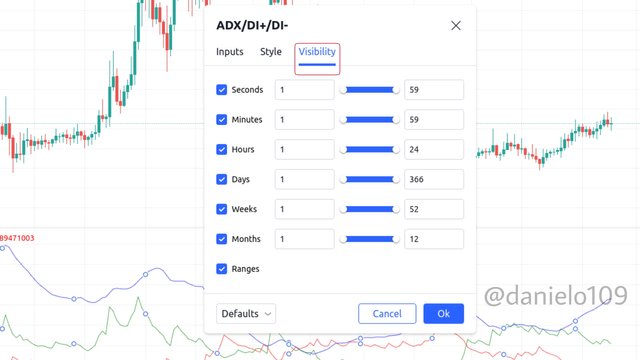
- At the visibility section, leave the settings at default.
What are the best settings and why?
The default settings are good to work with. That's 14 length period for the DI. This simply means that the calculation of the indicator is based on the last 14 periods of the time frame. If it is a one-day timeframe, it means the last 14 days are taken into consideration for the calculation.
Changing the settings is also possible and can be helpful depending on your trading style. What one must note is the shorter the period, the more responsive the indicator is to changes in price. This can cause a lot of false and misleading signals. Longer length periods help to smoothen the cure and reduce how often you see wrong signals.
Let's take an example to understand what I'm talking about. I'm going to use a short length period of 8 and ad longer period of 30.
- Length period of 8.
- Length period of 30.
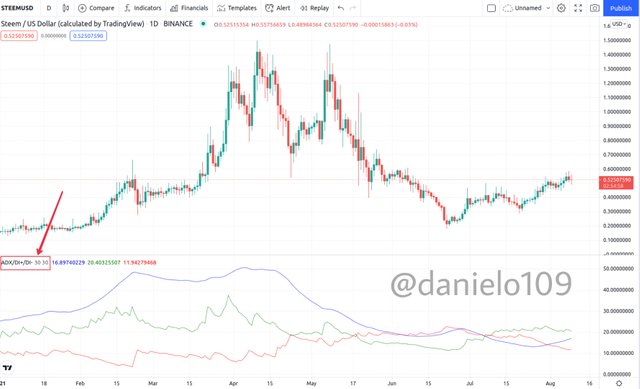
As you can see the shorter period is quicker to react as compared to the longer period. You can also notice a lot of wrong signals in the shorter length period(8) which has been filtered out with the longer length period(30). It is also recommended to use the ranges between 7 and 30 for the length period. If the length period is below 7 there would be a lot of false signals and if it is above 30 you could miss out on a lot of signals.
3 Do you need to add DI+ and DI- indicators to be able to trade with ADX? How can we take advantage of this indicator? (Screenshot required)
DI+ and DI- Indicators
Do you need to add DI+ and DI- indicators to be able to trade with ADX?
The DI+ and DI- indicators are also components of the Directional movement system developed by Welles Wilder. They are the main components of the Directional movement index (DMI) indicator. They are very helpful and needed to be able to trade with the ADX indicator. Some traders use just the DI+ and DI- indicators for analysis and trading. The ADX only helps to identify the strength of a trend without indicating the direction of the trend. The DI+ and DI- lines help to tell the direction of the trend. And so Yes, the DI+ and DI- indicators are needed to trade with ADX.
How do you take advantage of DI+ and DI- Indicators?
Like I said earlier, the DI+ and DI- help us to tell the direction of a trend. They tell whether the trend is bullish or bearish based on the positions of the DI+ and DI- lines. When the DI+ line is above the DI- line it indicates the trend is bullish. When the DI- line is above the DI+ line it indicates the trend is bearish. Also how far apart they are from each other shows how strong the trend is.
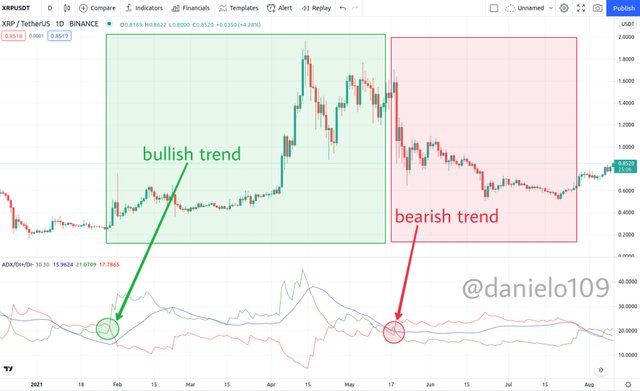
From the image above you can see how the crossovers of the DI+ and DI- indicators correspond to the direction of the trend.
Some traders also use the crossing of the DI+ and DI- lines as entry positions for trades. This isn't advisable though. This is because they mostly do not give the right signals. After all, they cross very often.
4.What are the different trends detected using the ADX? And how do you filter out the false signals? (Screenshot required)
Dectecting Trends with ADX indicator
There are 4 different types of trends detected with the ADX indicator as mentioned earlier. Would explain them below in detail.
Weak or no trend
If the ADX curve is within the range of 0-25, it indicates that the trend is weak or there is no trend in the market. This tells that the activities of buyers and sellers are low and there is low volatility in the market.
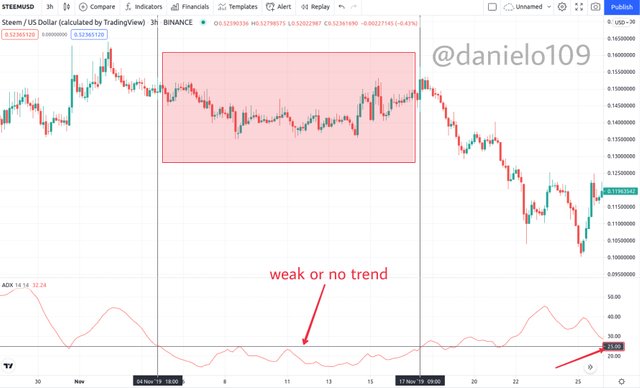
As you can see, from the STEEMUSD chart above, the ADX line below 25 shows low volatility. As it crossed above 25 you can see there was a trend and an increase in volatility of the market.
Existence of a trend
When the ADX is above 25, it indicates the existence of a trend in the market. This shows that there's an increase in the activities of buyers or sellers in the market and as a result, a bullish or bearish trend is developed.
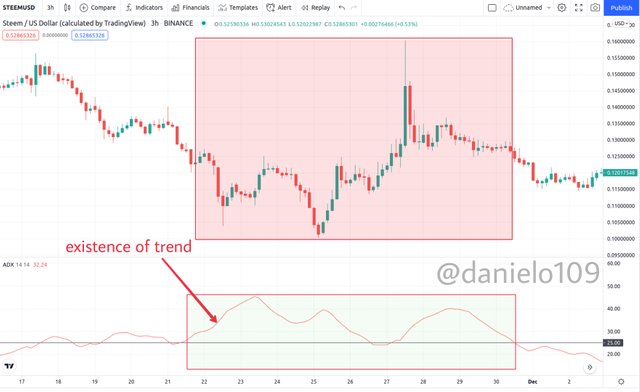
From the STEEMUSD chart above, you can notice the increase in volatility of the market as the ADX line is within the ranges of 25 and 50. You can tell there is a strong trend in the market.
Very strong trend
A very strong trend occurs when the ADX line is between the ranges of 50 and 75. This shows there's a lot of buying or selling pressure in the market as traders are buying in large volumes. In a very strong trend, volatility is very high.
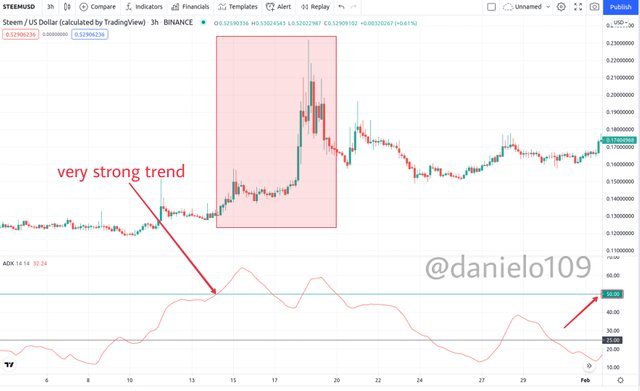
From the STEEMUSD chart above, you can see the tremendous increase in the price of the asset as the ADX ranges between 50 and 75. You can identify a very strong bullish trend. The ADX doesn't stay in this region for long. It falls within this range once in a long while.
Extremely strong trend
This type of trend occurs when the ADX is above 75. This is very uncommon but very possible when there is extreme volatility in the market due to news concerning assets which could lead to massive buys or sells in large volumes.
How do you filter out false signals with ADX?
False signals can be filtered very easily with the ADX. As shown earlier with how the ADX reacts with the 8 and 30 length periods, you can easily take out false signals. The reaction of the ADX is very quick with short length periods. It often gives a lot of wrong and misleading signals. A longer length period smoothes the ADX and filters out the wrong signals. Do not forget the recommended range for the ADX length period is 7 to 30. A length above 30 would filter out false signals and might make you miss important signals as well.
5.Explain what a breakout is. And How do you use the ADX filter to determine a valid breakout? (Screenshot required)
Determining Breakouts with ADX Indicator
A breakout is can be defined as the price movement of an asset outside a defined level of support or resistance. This usually happens when traders buy or sell in large volumes continually for a period of time. They are common in all markets and are key points for profit-making for traders.
Breakouts can be false or true. In the case of a false breakout, the price of the asset retraces after breaking out of any of the defined levels. A true breakout on the other hand continues to move in the same direction after breaking out.
How to use the ADX filter to determine a valid breakout
To use the ADX filter to determine a valid breakout, the 25 value of the ADX has to be taken into account seriously. As the ADX tells the trend is weak when it is between the ranges of 0 to 25, we ignore breakouts within those ranges and focus on those that cross 25. By doing so, you'll filter many false breakouts and be right with the valid breakout signals given by the ADX.
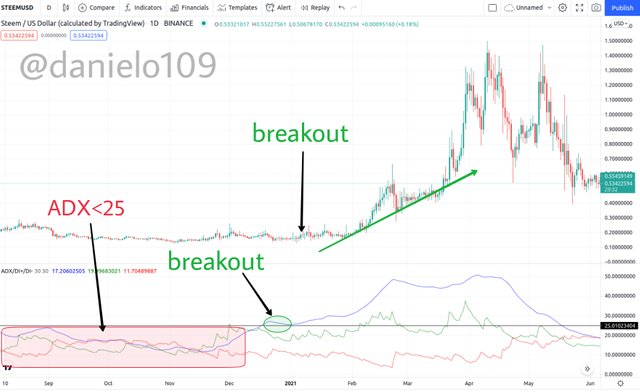
The STEEMUSD chart above shows a valid breakout given by the ADX indicator. As you can see the ADX less than 25 didn't give and valid breakouts. After it exceeded 25, there was a valid breakout as shown in the chart. One thing I've noticed is that the breakout is confirmed often when the DMI (DI+ or DI-) also crosses the 25 value alongside the ADX. You can notice this clearly in the chart above with the DI+ indicator crossing the 25 mark.
6.What is the difference between using the ADX indicator for scalping and for swing trading? What do you prefer between them? And why?
ADX Indicator for Scalping and Swing Trading
ADX for Scalping
Scalping involves trading on smaller timeframes like 1 min, 5 min and 15 min. ADX can be used effectively with scalping by helping to determine the strength of the trend and identifying support and resistance levels. With the DI+ and DI- inclusive, you can also determine the direction of the trend.
There is a con about the indicator with false signals arising from the use of short length periods that make it unreliable. However, there is a solution to this problem that allows you to trade with ADX effectively. You can use the Average True Range indicator and a period set to 100 to solve this problem. This makes it easy to identify the prevailing trend and covers the disturbances in the trend in the market.
ADX for Swing Trading
Swing trading involves holding for a couple of days or weeks to make gains within a short to medium term. The timeframes used can be short or medium like 30 min, 1 hour, 4 hour and 1 day. To use ADX effectively for swing trading you can add other indicators like the Pivot Points and the Ichimoku indicator. This would help locate the right entry points. It's advisable not to add too many indicators as you might lose track of your analysis and miss important signals.
Difference between ADX for scalping and swing trading
The difference between ADX in scalping and swing trading is that, in scalping, since it's quick and with short timeframes, ADX helps filter disturbances in the trend and identify the prevalent trend. For swing trading, ADX helps confirm entry points.
What do I prefer and why?
I would prefer using ADX for swing trading. This is because to me it filters out wrong signals better with medium time frames. It can also be used with other indicators to confirm the right entry points.
Conclusion
The ADX indicator is very simple and helpful. Though it has some cons, the pros make it worth using. Its main purpose is to indicate the strength of a trend. It also helps in filtering headlines without trends and can be used with other indicators for very strong and powerful trading strategies. Note that it's not a suitable indicator for taking entry positions as this could amount to losses.
Would like to thank @kouba01 for this great lecture.
Hello @danielo109,
Thank you for participating in the 7th Week Crypto Course in its third season and for your efforts to complete the suggested tasks, you deserve an 8.5/10 rating, according to the following scale:
My review :
An article with good content in which you answered all the questions effectively and with a clear methodology, but certain points must be mentioned.
Thanks again for your effort, and we look forward to reading your next work.
Sincerely,@kouba01
Thank you very much professor @kouba01. There's one thing though. The ADX with DI+ and DI- shows the components indicated in my homework with trading view. I think it differs with some users.
With the components indicated in your lecture, it's the DMI that has those components indicating the ADX as red with me. Thanks once again.
And the other point I'm sorry you misinterpreted me. I think it was my fault though, I didn't mean it as such. I actually meant it tells the strength of the trend regardless of it being in an uptrend or a downtrend. Would make sure to make things more clear and avoid misinterpretations next time.
Thanks once again
dang this thread is so detail! thank you so much! have any idea what site that can give me btc coin by playing online games?
if i like playing btc coins there are several sites that i can recommend for you at bk8asik[dot]com.
What kind of online games did you like to play before?