[Heikin-Ashi Trading Strategy]-Steemit Crypto Academy | S4W2 | Homework Post for @reddileep
1. Define Heikin-Ashi Technique in your own words.
The Heikin-Ashi technique is a type of candle representation of prices. The strength lies in its ability to help traders recognize and monitor trends easily. The word heikin ashi is a Japanese word which means 'average bar', the chart was given this name because of its method of constructing candles on the chart. Unlike the conventional Japanese candle sticks which begins the opening of a new candle from the end of the previous candle's end, Japanese candles starts from the center or middle of the previous candle's body.
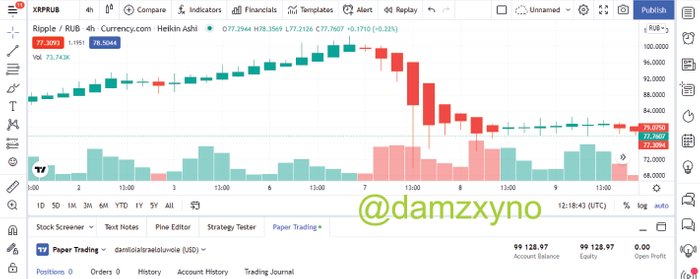
2. Make your own research and differentiate between the traditional candlestick chart and the Heikin-Ashi chart. (Screenshots required from both chart patterns)
The traditional candlestick chart and Heikin-Ashi chart look very similar expecially to the untrained eyes however, a number of differences exist between them, these differences are factors considered by traders to know which of them to employ in performing his speculations of a market.
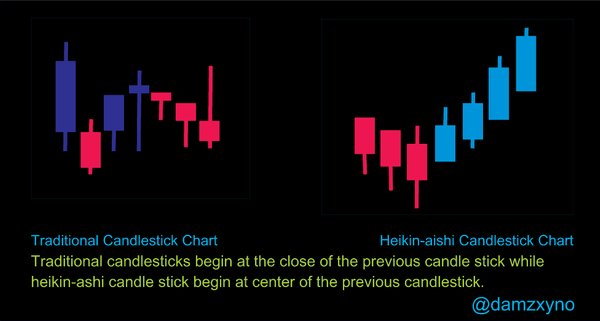
OPENING OF CANDLE
The opening of a traditional candlestick is at the end of the previous candlestick. However the Heikin-Ashi candle stick begins at the center of the previous candlestick's body. The formula for deriving the beginning of a new candlestick is averaging the open and close of the previous candle.
Mathematically:
CHART NOISE
Traditional candlestick do not make any calculation or adjustment to the data it displays on the chart. It plainly displays price movement in time hence there is presentation of noises. However, the heikin-ashi chart makes calculations and make adjustments to the data it displays. The heikin-ashi candlestick chart not only displays price but as well make appreciation of trends easier with less noise displayed. In addition, the heikin-ashi chart does not record minor price changes which adds to noises diplayed in the traditional candlestick chart.
EASE OF SPOTING PATTERNS
It is easier to spot patterns such as an uptrend or a downtrend in a heikin-ashi compared to a traditional candlestick. Uptrend, downtrend, reversals are all easier to spot in an heikin-ashi candlestick chart compared to spotting them in a tradition candlestick chart pattern.
PROFESSIONALISM
A lot of technical knowledge is required to read, understand and utilize information conveyed through a traditional candlestick. But the Heikin-Ashi candlestick is easier for new traders. However, not all information are displayed on the heikin-ashi chart, one of such is gap representation. Also, minor changes in prices are not reflected on the heikin-ashi candlestick.
3. Explain the Heikin-Ashi Formula. (In addition to simply stating the formula, you should provide a clear explanation about the calculation)
Unlike the traditional candlestick pattern which are independent of each other, the heikin-ashi candle stick is related to the previous candlestick.
Open = AVERAGE (OPEN, CLOSE of Previous Candlestick) || SUM (OPEN, CLOSE) / 2
High = MAX VALUE (HIGH | OPEN | CLOSE of Candle)
Low = MIN VALUE (LOW | OPEN | CLOSE of Candle)
Close = SUM (OPEN, CLOSE, HIGH, LOW) / 4
4. Graphically explain trends and buying opportunities through Heikin-Ashi Candles. (Screenshots required)
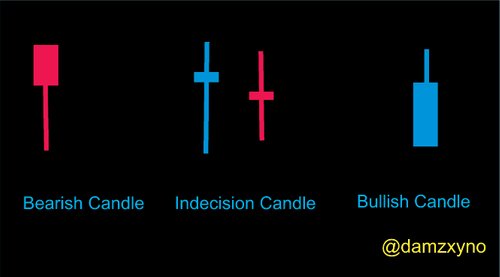
Like the traditional candlesticks, the heikin-ashi candles have two colors which represent an increase or decrease in the price of a crypto asset within a time frame. Blue is often used for a price increase candlestick and a red candlestick for a decrease in price. In heikin-ashi candlestick, the wick helps to determine if its an uptrend or downtrend. A blue candlestick with a long body and upper wick with no lower wick represents an uptrend while a red candlestick with lower wick and no upper wick represent an downtrend. While a candlestick with an upper wick and lower wick are usually transition stage, they are stages of indecision. Prices could go uptrend or downtrend after these candles. It is usually advisable to wait two candles more after these doji like candles before making a trading decision.
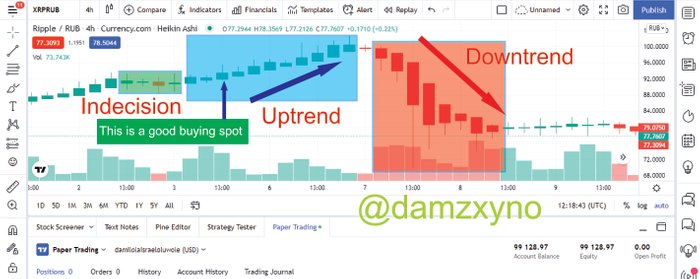
To make a trading decision, a trader waits for the indecision candlesticks because they usually represent transition stage. After the transition stage, a trader should watch for two or three more candlesticks to recognize the market direction.
5. Is it possible to transact only with signals received using the Heikin-Ashi Technique? Explain the reasons for your answer.
It is possible to trading using only the heikin-ashi technique especially for new traders who are not well informed (knowledgeable) about other technical indicators available.
However, it is a good practice to combine other trading technical indicators such as the Moving Average, RSI and KDJ indicators as this help seasoned traders make better decisions. The Heikin-ashi chart doesn't show the market behavior and as well ignores minor changes in price and gaps, hence it is better a trader combines this chart with other technical indicators.
6. By using a Demo account, perform both Buy and Sell orders using Heikin-Ashi+ 55 EMA+21 EMA.
For this tasks, I used a demo account on tradingview.com. I changed the traditional candlestick chart to Heikin-ashi candlestick chart and added the 55 EMA and 21 EMA to the chart.
BUY ORDER
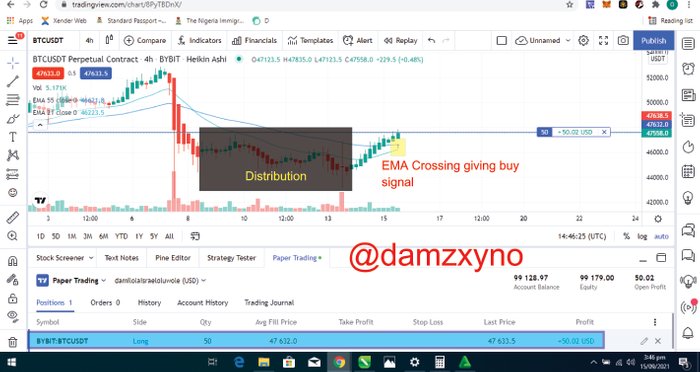
For the buy order, I traded the BTCUSDT pair. As shown in the screenshot of the trade above, I bought 50 BTC when the EMA line crossed at the exchange rate of 47,632.00 USDT. The market has been experiencing an uptrend as seen in the bullish heikin-ashi candles. It is speculated that this price will continue to rise. I set a stop loss at 46,000.00 usdt which is still in the not greater than 20% loss margin.
SELL ORDER
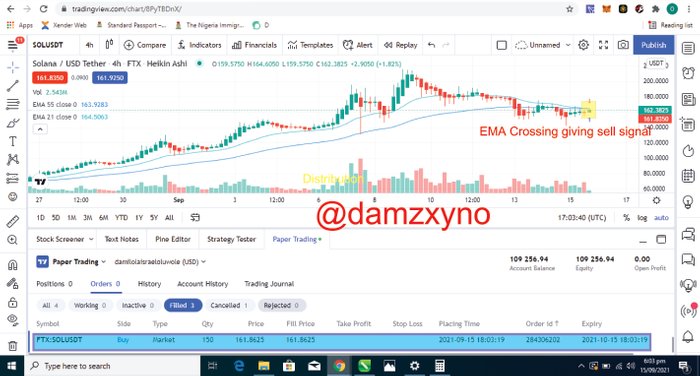
For the sell order, I traded the SOLUSDT pair. As shown in the above screenshot of the trade, I sold 150 SOL when the EMA line crossed at the exchange rate of 161.8 USDT. The market slowly declining, so I traded at a indecisive candlestick in accordance to the EMA lines. It is speculated that this price will continue to slowly decline.
Conclusion
The heikin-ashi technique is an alternative to the traditional candlestick chart. It shows more information about prices in relation to one another within a specific period of time. Trends are easier to monitor on the heikin-ashi technique and this is a very important factor that favors this technique above the traditional candlestick technique.
The heikin-ashi technique is not completely effective, no chart or indicator is . Hence it should be combined with other indicators to help make good trading decisions.
Thank you!