Crypto Trading With SuperTrend Indicator – Crypto Academy /S5W7-Homework Post for kouba01
Basically all traders do not want to suffer losses, all want to get profit from trading results but sometimes what we expect is not the same as the reality. That's why many traders do technical analysis in advance of a security to determine entry and exit points, or to find divergence signals. This time we will discuss the SuperTrend indicator, one of the best indicators used to predict the direction of the trend.
This post is the homework given by professor @kouba01, after I did my research and wrote it as best I could, so this is the result of my work.

1. Show your understanding of the SuperTrend as a trading indicator and how it is calculated?
What is the SuperTrend indicator?
One way for traders to distinguish between trend direction and trend inversion is to use the Average True Range (ATR). A trend reversal can be identified based on how the price reversed direction in the direction of the previous trend with the ATR multiple. For example, if the price falls by more than three times the ATR coming from the high of the uptrend, the uptrend can be considered reversed.
If you already understand well about the ATR indicator, then it will not be difficult for you to understand the indicator that we will discuss this time, namely the SuperTrend indicator. Because this indicator is based on the concept of ATR.
The SuperTrend indicator is a very good indicator used to predict the direction of the trend. The SuperTrend Indicator calculates the ATR of tradable securities based on a predefined number of periods from the input of the SuperTrend Indicator. Then multiply ATR by the multiplier also set for the indicator input.
The result is used as the distance over which the supertrend indicator plots a line opposite to the trend direction originating from the high or low of the trend. The SuperTrend indicator has a default setting of 10 ATR cycles and a multiplier of 3.
In an uptrend, the SuperTrend indicator line will be green and below the price action. And in a downtrend the red line will be above the price action. Only when the price closes on the other side of the line will the line shift and change color, indicating an inversion.
This indicator has many uses for conducting technical analysis of a security. However, based on our observations, there are 3 main uses for the SuperTrend indicator.
One of them is as a trend reversal indicator. The shift of the SuperTrend line and its changing color indicates a trend reversal based on the ATR based trend concept. Therefore, traders can use this line shift and color change as a trend reversal signal and make trade entries based on it.
Another use is as a trend direction filter. Here, traders only trade in the direction indicated by the SuperTrend indicator.
This indicator can also be used as a stop loss measure. Traders can place and track stop-losses behind the SuperTrend line, knowing that the trend is considered reverse if the price closes on the other side of the SuperTrend line.
Just like trend indicators in general, this indicator will work more perfectly in trending markets and also in intraday trading. But we can also use this indicator for a longer term, this depends on the needs of the traders.
The market will be said to be Uptrend if it is in the green line. And Downtrend when it is below the red band. In addition, each band is considered a support line and a resistance line and is used as a guide for entry and profit and stop loss.
How to calculate the SuperTrend indicator?
The SuperTrend indicator is calculated using the Average True Range (ATR), the formula is as follows:
- UpTrend (Lower Line) = (High + Low) / 2 - Multiplier x ATR
- DownTrend (Higher Line) = (High + Low) / 2 + Multipier x ATR
We have to calculate ATR first to get True Range. Then the following formula will be used:
ATR = [[ 13 × Prior ATR] + current TR] / 2
14 is the period and derivative of ATR which is done by multiplying the first ATR by 13. After that, we have to determine the current TR by adding it, then divide now with the period.
2. What are the main parameters of the Supertrend indicator and How to configure them and is it advisable to change its default settings? (Screenshot required)
The SuperTrend indicator has two parameters, namely period and multiplier, the default setting of this indicator is 10 for the period and 3 for the multiplier. But of course we can change it based on the needs of each trader, so let's add this indicator first before I explain the settings.
Added SuperTrend indicator to chart.
Open TradingView, then click chart.
We will be immediately directed to the chart on the TradingView site.
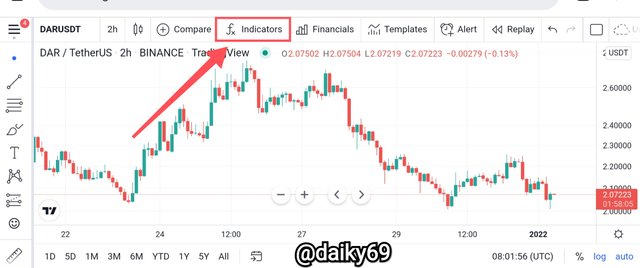
- Next, click on the indicator to add the indicator we want.
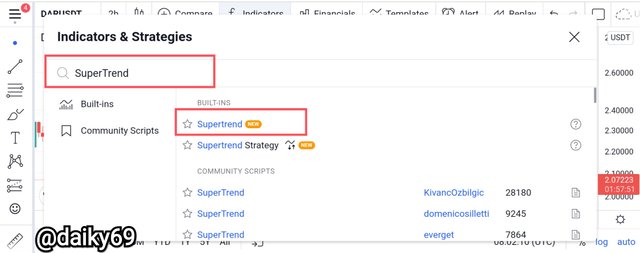
- To find the Indicator we need, then type SuperTrend in the search field and add the indicator to the chart.
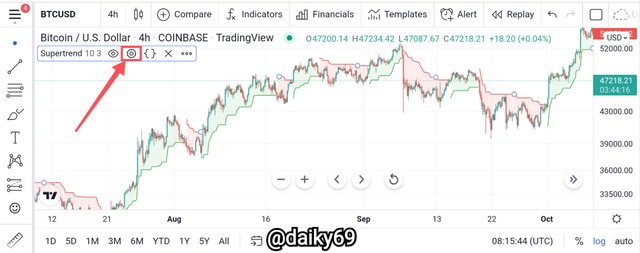
- The SuperTrend indicator has been successfully added, now we can configure it according to our needs. Click on indicator settings.
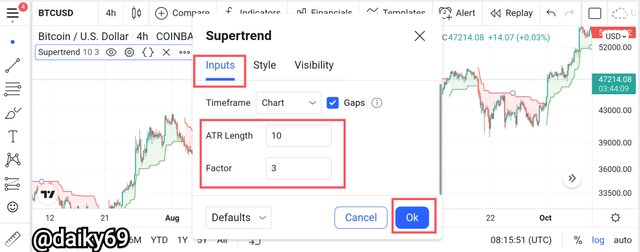
- In the "input" menu we can change the period and multiplier as needed.
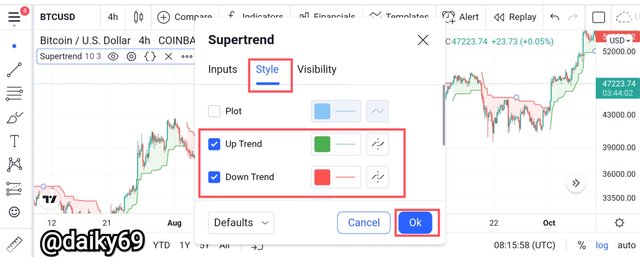
- In the "style" menu we can change the color of the uptrend and downtrend lines of the SuperTrend indicator.
Is it advisable to change its default settings?
The number of ATR settlement periods, by default is 10. The volatility multiplier, measured by ATR, by default is 3, when the parameter decreases, the instrument reacts more actively to price changes, but the probability of false signals also increases. It is recommended to increase this multiplier if the asset is experiencing increased volatility and if the asset is unstable, we can decrease the default value.
As I mentioned above, the value of the multiplier can be lowered if we want the SuperTrend indicator to react more quickly to price changes, but in this case it can create quite a number of false signals. Therefore, we are required to be wise in using the parameters on this SuperTrend indicator in order to get analysis results that suit our needs and work perfectly.
As an example, I will compare the signal generated by SuperTrend with different multipliers.
1. Default setting vs 10 period with 7 multiplier
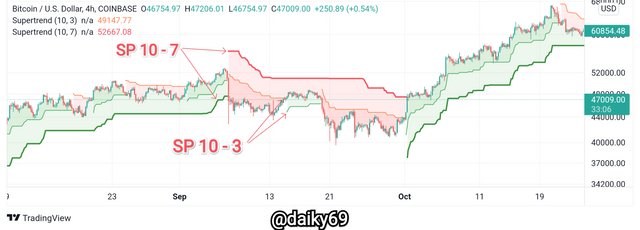
Here we can see that periods are more active in signaling, even in markets with short-term swings. While the period 10 multiplier 7 is more effectively used for a longer time, for example 4H and so on because small changes in the market will not make the indicator generate a buy or sell signal.
2. Default setting vs 10 period with 5 multiplier
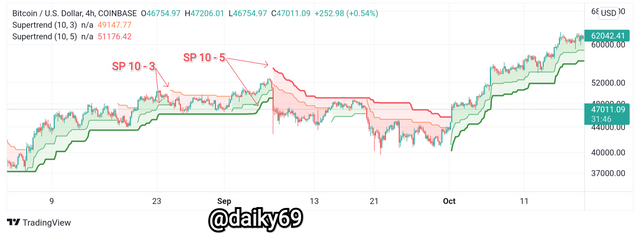
This setting is also not much different from the settings above, the signal generated is relatively reduced and small changes in the market will not produce false signals.
3. Default setting vs 10 period with 2 multiplier
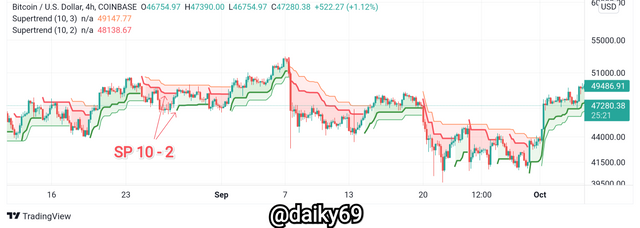
It can be seen that, the signal generated by this setting is more than the default setting. And this will result in wrong decision making or wrong entry and exit points due to the large number of false signals. Maybe this setting is more suitable for us to use for short-term trading, 5 to 45 minutes.
3. Based on the use of the SuperTend indicator, how can one predict whether the trend will be bullish or bearish (screenshot required)
Uptrend
How to detect an uptrend on the SuperTrend indicator?, It's quite simple, as I described above that, when the line starts changing from red to green color and is under price action, then followed by a price increase to the top, then we can confirm that it is an uptrend signal.
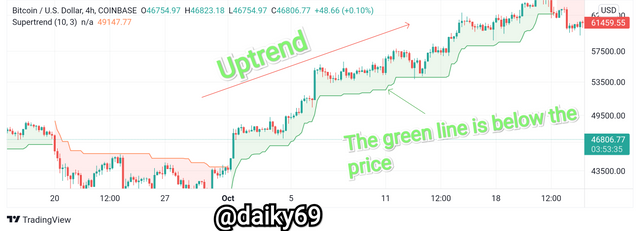
I think the chart above is sufficient to explain how uptrend signals can be identified on the SuperTrend indicator. Because after the red line that was above the price action ended up turning green and was below the price action, the market experienced a very strong uptrend.
Downtrend
The opposite of an uptrend signal, when the green line turns red and is above the price action followed by a downward price movement, this can be confirmed as a downtrend signal.
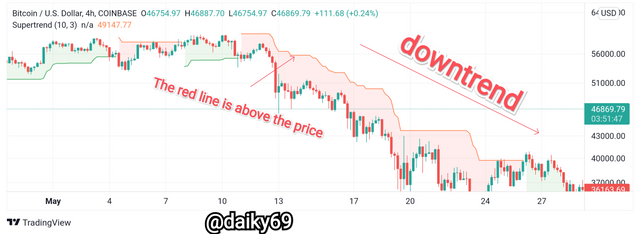
We can see a real example in the chart above, where when the green line under the price action turns red and rises above the price action, it is quite far from the price action. Then the market experienced a downtrend which indicates that the downtrend signal is working quite well.
So that's how we predict whether the trend will be bullish or bearish, by looking at the line movement of the SuperTrend indicator. The green line below the price action is a bullish signal, while the red line above the price action is a bearish signal.
4. Explain how the Supertrend indicator is also used to understand sell / buy signals, by analyzing its different movements.(screenshot required)
All traders use indicators to conduct technical analysis of a security so that they can find the right entry and exit points, the same goes for the SuperTrend indicator. Even with the SuperTrend indicator we can more easily find the right entry and exit points.
This indicator has different colors for Bullish and Bearish markets, when we detect a trend change, it is a buy/sell signal that we can use to quickly enter or exit the market. This is not much different from the discussion in number 3, because after we see that the market has changed direction, we can immediately place our entry in the market.
When the downtrend ends, which is indicated by a change in the color of the SuperTrend line from red to green, we can place a buy order and vice versa. Look at the chart below for clarity.
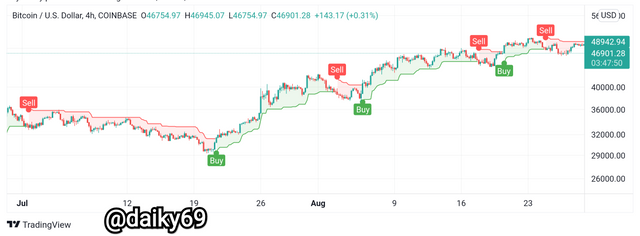
Keep in mind that in a trending market the lines from the SuperTrend will become dynamic support and resistance levels, whereas in an uptrend market the green lines under price action will become dynamic support levels. Whereas in a downtrend market the red line above the price action will become a dynamic resistance level.
So when the price breaks above the red line, the color of the line will immediately change to green and that is an expected buy signal. And when the price breaks below the green line, and soon the color of the line will change from green to red, then this is a sell signal that we can use to get out of the market.
5. How can we determine breakout points using Supertrend and Donchian Channel indicators? Explain this based on a clear examples. (Screenshot required)
Now we will combine the SuperTrend indicator with the Donchian Channel. What we are looking for here is a breakout on the Donchian Channel to filter the signals generated by the SuperTrend indicator. As we know that the Donchian Channel is an indicator that we can use to see trend changes, this indicator is almost the same as Bollinger bands but has contrasting differences in terms of calculation and the style used.
When the price breaks through the upper band of the Donchian Channel, it indicates that the market is about to enter an uptrend. On the other hand, when the price breaks through the lower band, this is a downtrend signal. So we will use these signals to filter the signals generated by the SuperTrend indicator.
Supposedly, when the price breaks through the upper band of the Donchian Channel, the SuperTrend indicator will also give a buy signal, and when the price breaks through the lower band of the Donchian Channel, a sell signal will also occur on the SuperTrend indicator. So let's see, if this thing will work well.
Uptrend
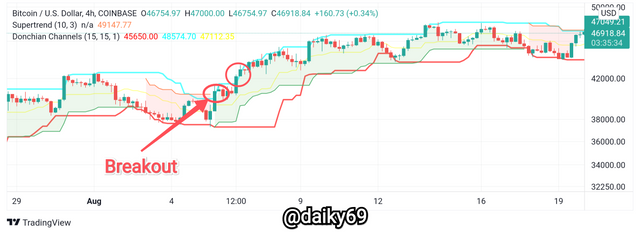
When the candle breaks through the upper band of the Donchian Channel, the SuperTrend indicator confirms it by giving a buy signal. Both indicators are able to provide fairly precise signals without significant delays, so we can immediately enter the market after a breakout on the Donchian Channel, we recommend waiting for two candles to break through the upper band of the Donchian Channel to confirm a strong buy signal.
Downtrend
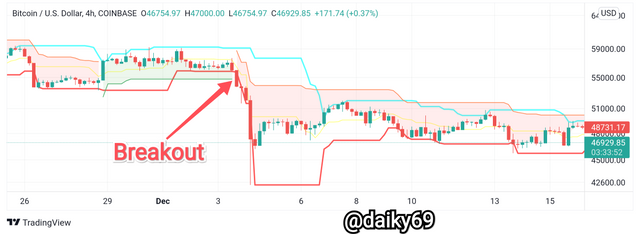
On this bearish signal we can see that the SuperTrend indicator gives a faster signal to the Donchian Channel, but we can confirm and confirm a sell signal when there are two candles that break through the lower band of the Donchian Channel. It can be seen that these two indicators work very well when we integrate them together, so always be careful with false signals.
6. Do you see the effectiveness of combining two SuperTrend indicators (fast and slow) in crypto trading? Explain this based on a clear example. (Screenshot required))
I personally think that the combination of two SuperTrend indicators (fast and slow) is very effective in giving uptrend and downtrend signals. One SuperTrend to detect signals and trend changes, while the other for confirmation. Just look at the picture below to make it clearer.
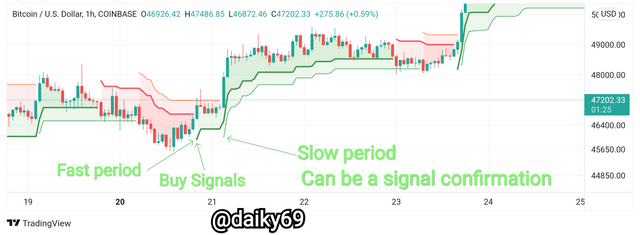
In the chart above we see that the fast-period SuperTrend gives a buy signal first compared to the slow-period SuperTrend. So when we have doubts about the buy signal in the fast version of the SuperTrend indicator, then we can wait for the signal on the slow version of the SuperTrend indicator, if the slow version also confirms the signal then we can immediately enter the market.
So it can be said that this is a very effective combination, the fast version is for detecting the signal while the slow version is for signal confirmation.
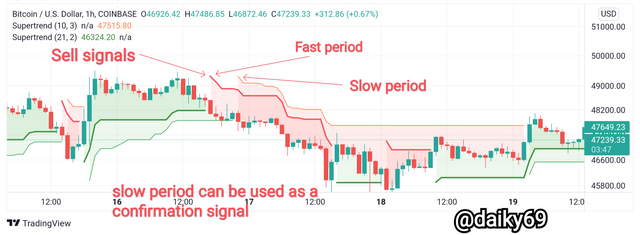
For bearish signals or sell signals the same applies, the fast version of the SuperTrend indicator is used to detect signals, while the slow version is used to confirm signals. It can be seen that these two SuperTrend indicators work very well and are effective as signal detectors and filters.
7. Is there a need to pair another indicator to make this indicator work better as a filter and help get rid of false signals? Use a graphic to support your answer. (screenshot required)
It is undeniable that we must always use several indicators at once in terms of technical analysis, we can almost say this is mandatory because all indicators will not always produce accurate signals, sometimes these indicators will give false signals and the SuperTrend indicator is no exception.
I admit that this indicator is very good and works very well, when doing a combination of two SuperTrend indicators at once with a faster and default period. But still we have to use other indicators to filter out false signals that appear on SuperTrend, so will have to combine SuperTrend indicator with other indicators for signal confirmation and also filter out false signals.
Because this is a trend indicator, I prefer to combine the SuperTrend indicator with SMA or Bollinger bands. Because what we are looking for here is a trend change to determine the entry and exit points of the market. So I thought it would be helpful if I combined it with SMA or BB. Note however that, we should use this on a slightly longer timeframe, such as 1H - 4H.
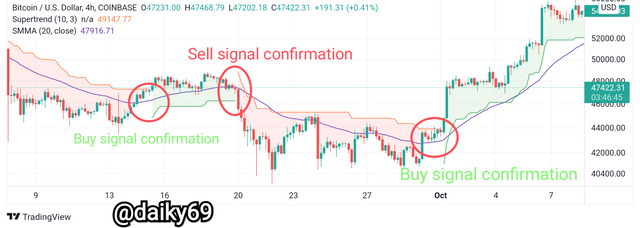
In the chart above, I will place a buy order when both indicators give the same signal, namely the price crossed above the SMA line followed by the green line signal on the SuperTrend indicator and vice versa. But if one of these two indicators does not give the same signal then I will consider it a false signal.
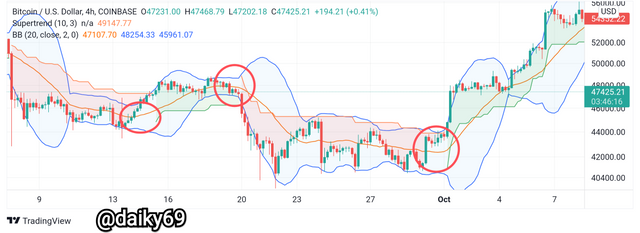
The same thing I will do on the SuperTrend indicator with Bollinger bands. If the candle is still in the middle line of the Bollinger bands then I will not take any entry, I will still wait until both indicators produce the same signal which we can consider a valid signal.
8. List the advantages and disadvantages of the Supertrend indicator.
*Advantages:
This indicator is very simple with very good effectiveness in my opinion although there is a bit of lagging.
This indicator can be used by all circles, novice traders and can also use this indicator because it is very simple and easy to understand.
This is an excellent indicator used to track trends, and trend changes are also very easy to identify by changing the color of the line from green to red or vice versa.
The indicator is reliable when we combine it with other indicators, such as the Donchian Channel or other indicators.
Disadvantages:
Since it is a trend indicator, it makes this indicator work very poorly in a sideways market.
The sensitivity of the indicator is poor when we reduce the multiplier, it even produces a lot of false signals.
We can only use the indicator for trending markets, so this indicator will not be useful at all if used for range and sideways markets.
Conclusion
The SuperTrend indicator is an effective tool for identifying trending markets and showing traders useful signals for making trading decisions. This indicator is also very easy to use so that it can be understood by all traders.
The indicator is able to analyze historical and current price information to help predict future price fluctuations. In addition, the SuperTrend Indicator is also an indicator of the mathematical operation of the price and/or quantity of a security which is intended to predict future price fluctuations. The decision on how to open or close a position can be based on signals from technical indicators.
Although this indicator is not good for use in the range market, the indicator is still very reliable if we combine it with other indicators such as the Donchian Channel. Then it can be ascertained that the resulting signal is truly accurate and this has been proven.