Bitcoin analysis: 6 hour timeframe
The chart pattern that captures price action of Bitcoin on its 6 hour timeframe from March 18, 2018 to present date is a symmetrical triangle.
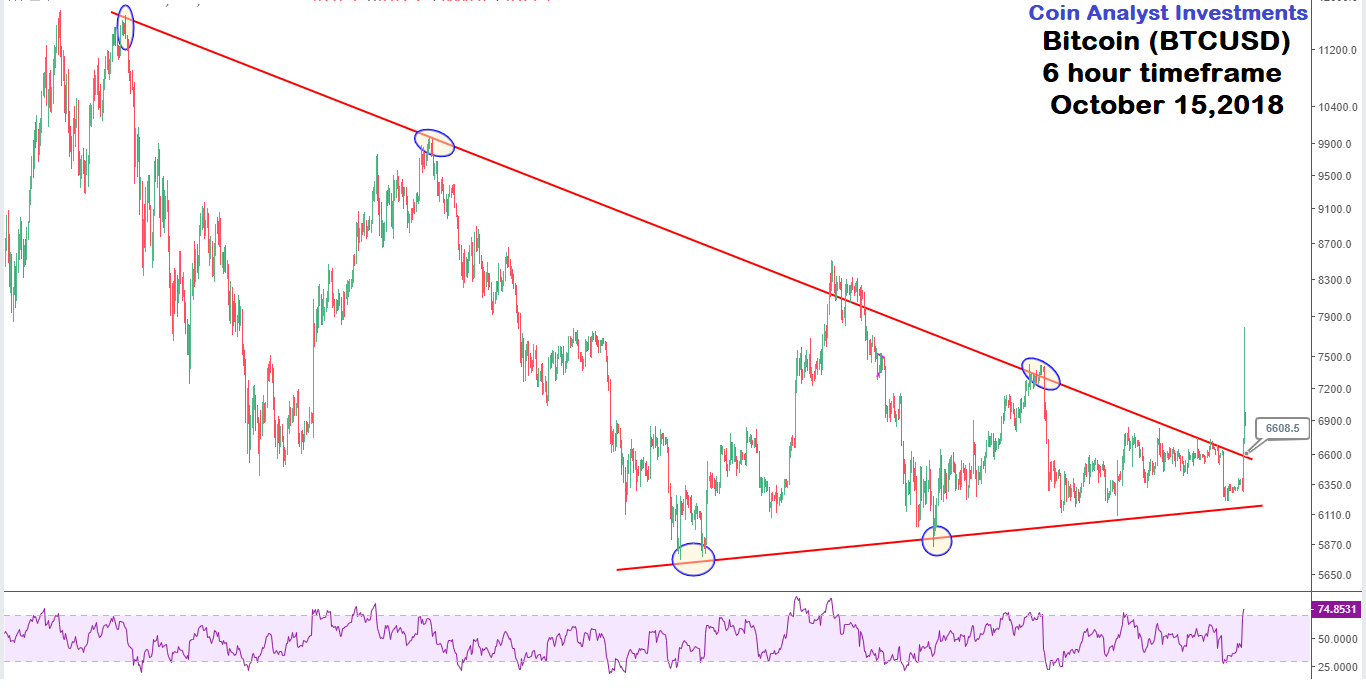
Price successfully closing outside of the triangle at ~$6,608.50 implies more upside momentum for Bitcoin, albeit current correction after breakout from the chart pattern.
Bitcoin closing back below ~$6,215.70 would possibly trigger more selling. A logarithmic scale was used in this Bitcoin analysis, and therefore requires an arithmetic scale for any physical measurements using the width of the pattern, which is a great way to estimate the minimum termination price level for Bitcoin.
Interested in Litecoin (LTCUSD)? Check out our previous analysis below.
https://coinanalyst.investments/2018/10/14/ltc-analysis/
Moreover, EURJPY (FX) analysis can be found here.
https://steemit.com/forex/@cryptotrader0029/eurjpy-with-a-double-bottom-pattern-6-hour-tf-analysis