Bitcoin (BTC) Update: Bollinger Bands, RSI, Stoch, MACD & More!!

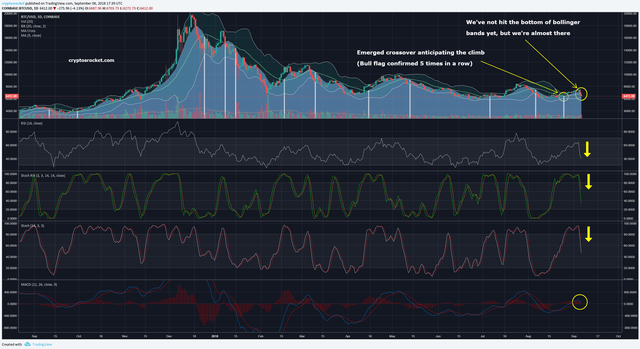
We've not hit the floor of the bollinger bands yet... we still have some margin down, but we're almost there.
Let's see how the indicators are now...
RSI - It was time for a dip here as it had a continuous climb until almost overbought levels.

Stochastic RSI - It was at overbought levels for a looong time... finally came down.
Stochastic - It was at overbought levels for a while before the dip.


MACD - A closer look reveals that a cross-down looks quite natural and on smaller scales it has already occurred.
At the moment, it’s not just the cryptos market that’s down. All the major indexes opened lower this morning: Dow Jones, S&P, Nasdaq, WTI Crude…
Conclusion: Putting all this together… it’s not unexpected that a minor correction happens at that moment, right? The MACD indicator shows that bears have been losing their strength since the beginning of the major correction.
DISCLAIMER: None of CryptosRocket content is investment or financial advice. Please do your own research before investing and invest at your own risk. Do not invest more than you can afford to lose and consult a financial advisor if necessary.

http://cryptosrocket.com/btc/2018/09/06/bitcoin-btc-update-bollinger-bands-rsi-stoch-macd-more
