NEO/BTC Technical Analysis - توقعات سعر ال نيو - Feb 26, 2018
Welcome to our third Technical Analysis post and based on community members request we are doing a TA on NEO
Please feel free to join our Discord app community at https://discord.gg/WBQYyBg
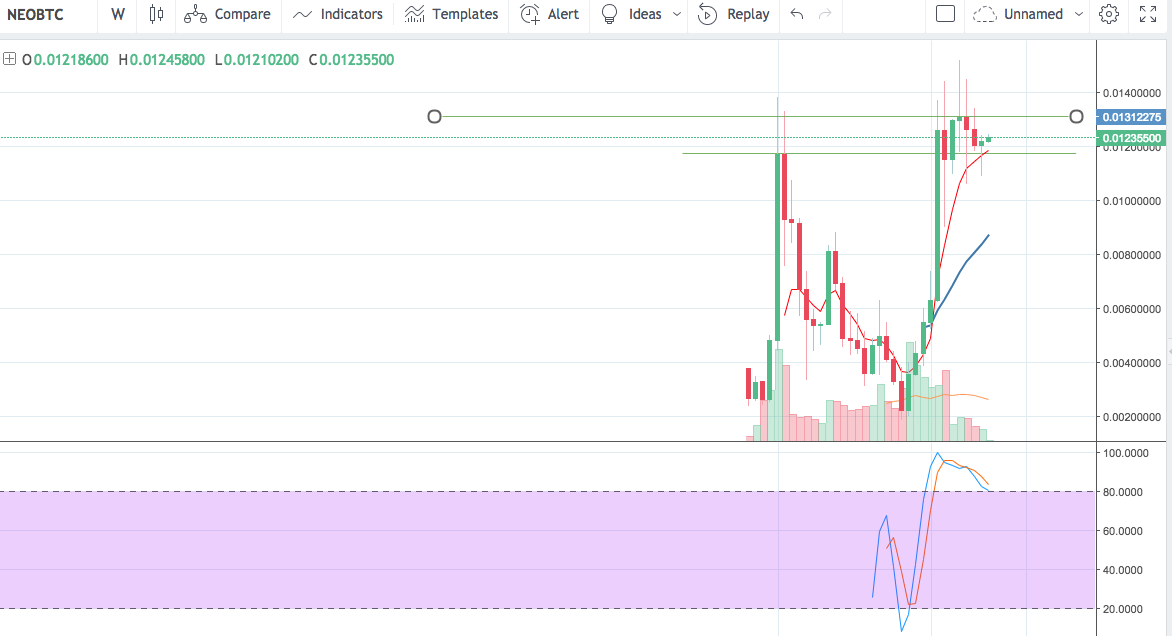
Weekly overview:
Having a high correlation with Ethereum, NEO has also formed a rising star formation last week and is set for another high to 0.013 to say the least.
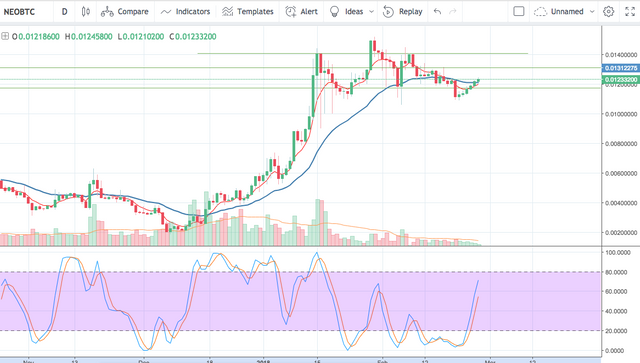
Daily overview:
On the daily chart, things look very positive, Stochastic indicator shows that price is moving upwards in a strong angle and has a lot of room before reaching overbought zone. It is likely to reach 0.013 level then if it closes above it, it may reach 0.014 (both being take profit points)
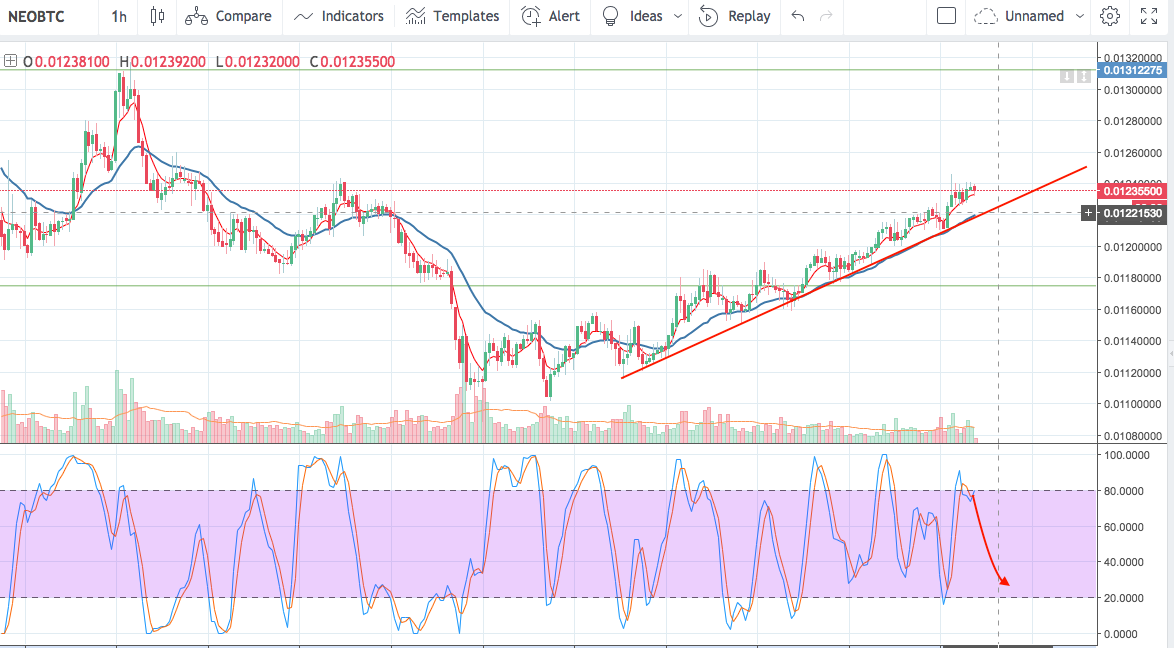
Hourly Overview:
As you can see on the hourly chart, the price is in a strong uptrend (redline support below). NEO is already in an excellent entry point, it may slightly retrace down to 0.0122 level as stochastic indicator is showing a week momentum but still the general direction is still up and and slight price drop on the hourly chart is another good entry point.
Conclusion: Positive momentum for NEO , take profit points at 0.013 and 0.014 if you are more risk averse.