Bullish Hopes Are Broken Again As Bitcoin, Litecoin, Monero And NEO Decline on Monday
Weekend bullish scenario seems to end up as the currency pairs move downwards

Bullish scenario progressed on weekend after a true fiasco on Friday as all the reviewed currency pairs declined significantly, establishing new local lows.
However, the situation has changed on Saturday as all the reviewed currency pairs were able to move higher and to form a kind of an uptrend. On Monday we see the contrary picture as all the allies go downwards, breaking levels and trend lines. It seems like bears want to remind bulls who is in control of the markets currently.
BTC/USD
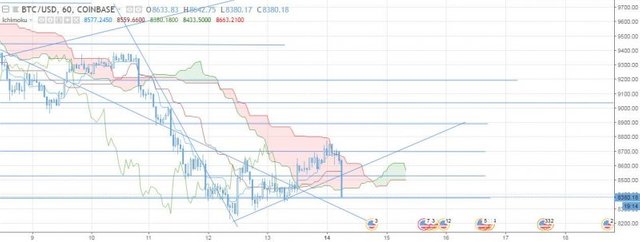
Bitcoin has broken through the short term descending trend line on Friday and retested it later. Then BTC/USD jumped off this trend line and started to grow slowly with wide range fluctuations allowing to earn both bulls and bears.
We have drawn an ascending trading line, which supported the price during the weekend. The currency pair entered the Ichimoku cloud on Sunday and even reached its upper border. Bitcoin has tested it and the resistance level at 8 694.
Later, bears have taken control again and pushed the currency pair lower for another correction. Bitcoin has tested the ascending trend line and crossed it meaning the end of this short-term upside tendency. It has also broken through the support line at 8,528 area.
The currency pair has reached the next support line at 8,372 are in the moment of writing. Bears make attempts to cross it. There are two scenarios here. The first one means BTC price will jump off this 8,372 support line area and reverses towards the resistance area at 8 528. However, bulls will have to deal with another obstacle- the lower border of the Ichimoku cloud. If successful, they will be able to test the resistance.
The other scenario for Bitcoin is the breakout of the current support area at 8,372 with the development of local downtrend.
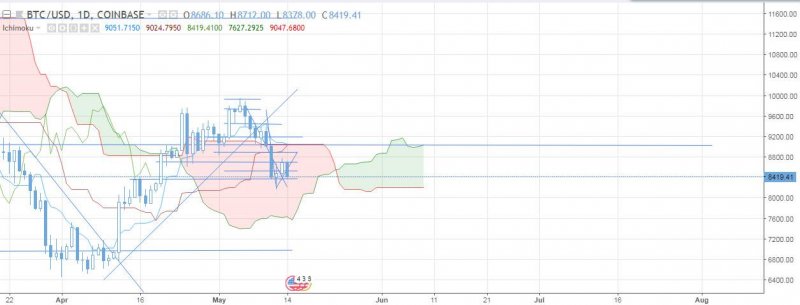
Let’s have a look at the daily chart. Here the situation remains unchanged as the price stays still within the Ichimoku cloud in the middle of the formation. Bulls were trying to counterattack but in the moment of writing the candlestick bearish. It is better to wait until it forms to make any conclusions.
LTC/USD
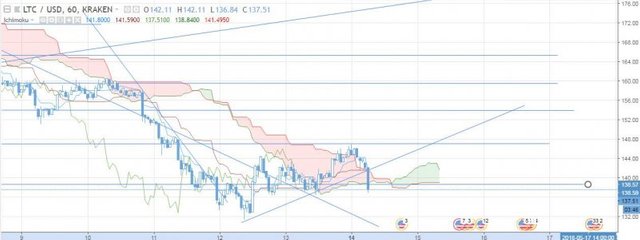
Litecoin follows Bitcoin as the price has crossed the descending trend line on Saturday and then went slightly upwards along a new local ascending trend line that we have drawn recently. LTC/USD managed to cross the upper border of the Ichimoku cloud unlike Bitcoin but then started to decline.
Litecoin has broken through the ascending trend line recently and is testing the support area at 138. Litecoin price shifted even lower this line but returned above later meaning the breakout was false. LTC price resides below the Ichimoku cloud as bears control the market for the moment.
There are two possible scenarios here. Litecoin will reject the support area and go through the Ichimoku cloud (which is thin here) to test the local ascending trend line from below and then to reach the resistance area at 147.
If LTC/USD fails to jump off the support area, it is able to develop the downtrend towards Friday’s lows and the midterm descending trend line.
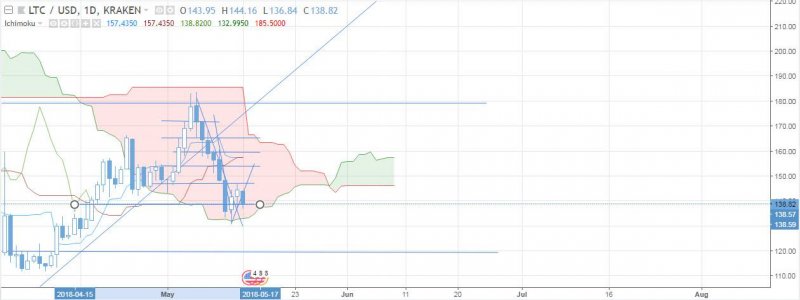
As for the daily chart, Litecoin has reached the lower border of the Ichimoku cloud and jumped off it meaning there is an opportunity for bulls to gain initiative. However, it is better to wait until today’s candlestick forms as it is bearish now.
Check more details on XMR/USD and NEO/USD pairs HERE and also post review HERE