Bitcoin - Price Prediction & Analysis for next 24 hours: 18th Aug 2017
The Bitcoin price hit a new all-time high of $4480, It is soon onto $5000, Bitcoin marked a stable resistance at $4360. The indicator for a very long time is in the overbought zone, saying that the current price of Bitcoin is clearly overstated and correction is necessary downwards. On the hourly chart, Stochastics had a small downward correction in order to leave the overbought zone in the neutral zone. In the case of downward movement and penetration of support $4158, we sell the asset at a price of $4070. If Bitcoin continues its growth and breaks resistance level $4360, we continue to purchase, starting at $4340. The asset's capitalization is $ 71.53 billion.
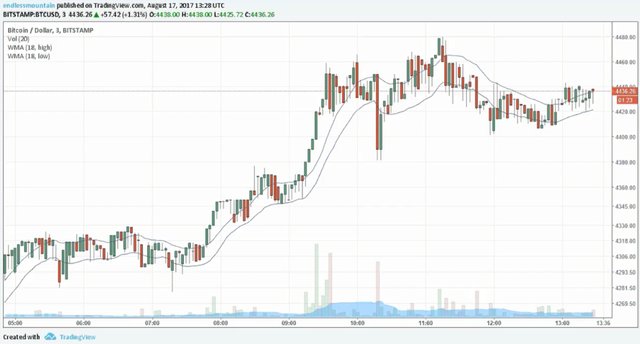
Chart Credit: Tradingview.com
We all considered $ 5,000 as the next main threshold. All this remains. The fact that we consider this level as one of the main goals does not mean that we cannot allocate several closer long-term goals and get short-term profit from volatility. As the chart shows, our range is defined support at $4160 and resistance at the top of $4470. At this point, we're going to go to the market with our breakthrough strategy, Thus, if we see that the price closes above the resistance, we will go with long positions in $4560. Stop about $4460 ensures that we will be automatically withdrawn from the market in case of change of direction.
However, in a long-term bitcoin will reached to $7000, but in November 2017 there will be new Bitcoin card hard fork launch as third bitcoin split. On break-point you may see in figure the market should continue to go up higher. As an investor in both bitcoin, gold and precious metals in general, I'm keenly interested in keeping up on the price and using basic technical analysis for bitcoin price prediction in 2017 and beyond.