CRYPTONITE-ELITE EOS CHARTS 1/20/2019
The chart below gives us a look at EOS's % volume of market cap (blue line) and EOS's % increase/decrease close to close (red line) for the past 30 days.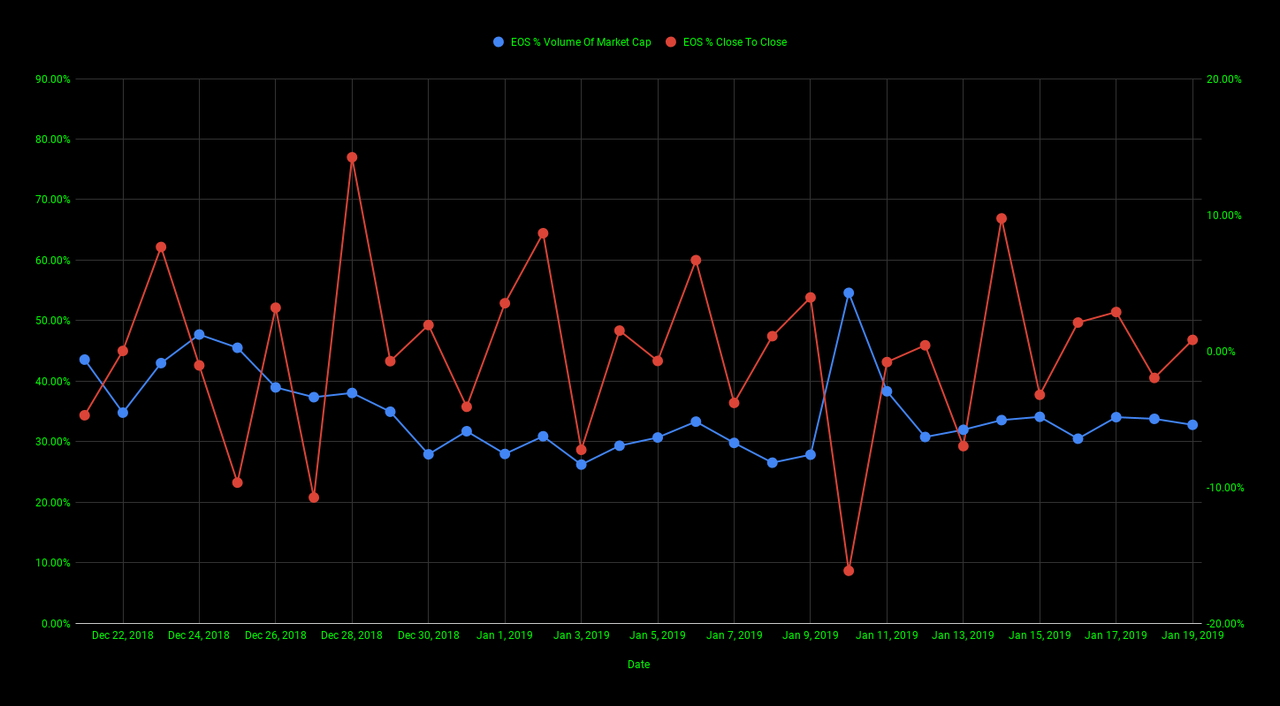
The chart below gives us a look at EOS's marketcap (blue line) and EOS's closing price (red line) for the past 30 days.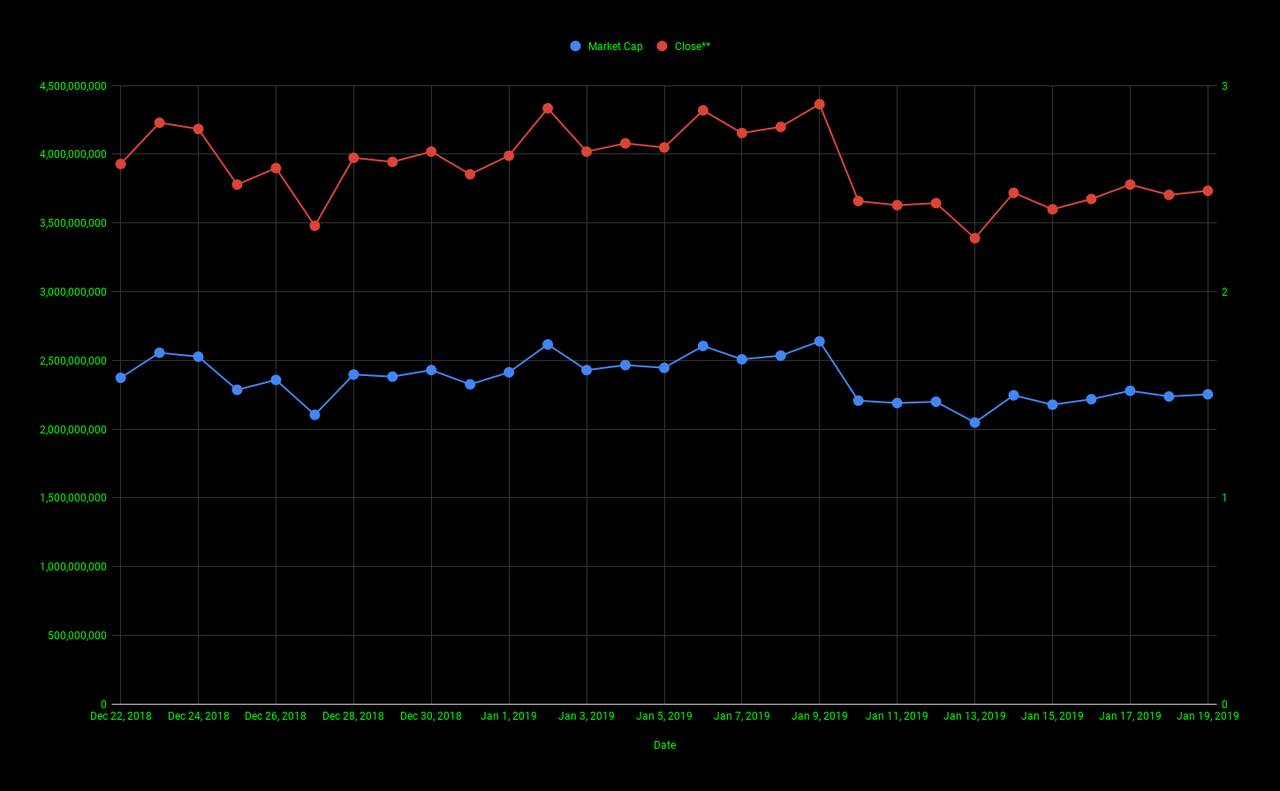
The chart below gives us a look at EOS's closing price (blue line) and EOS's volume (red line) for the past 30 days.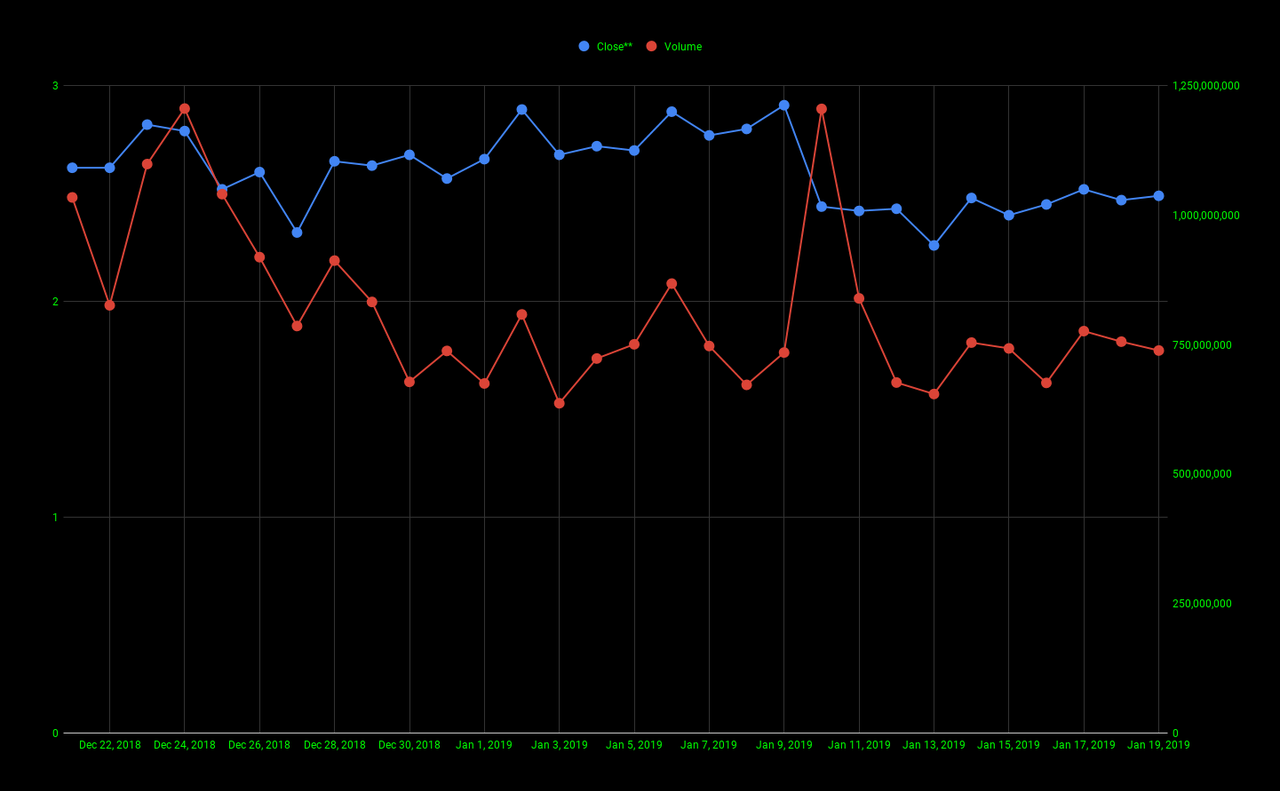
The chart below gives us a look at EOS's % increase/decrease open to open (red line), % increase/decrease high to high (yellow line), % increase/decrease low to low (green line), and % increase/decrease close to close (blue line) for the past 30 days.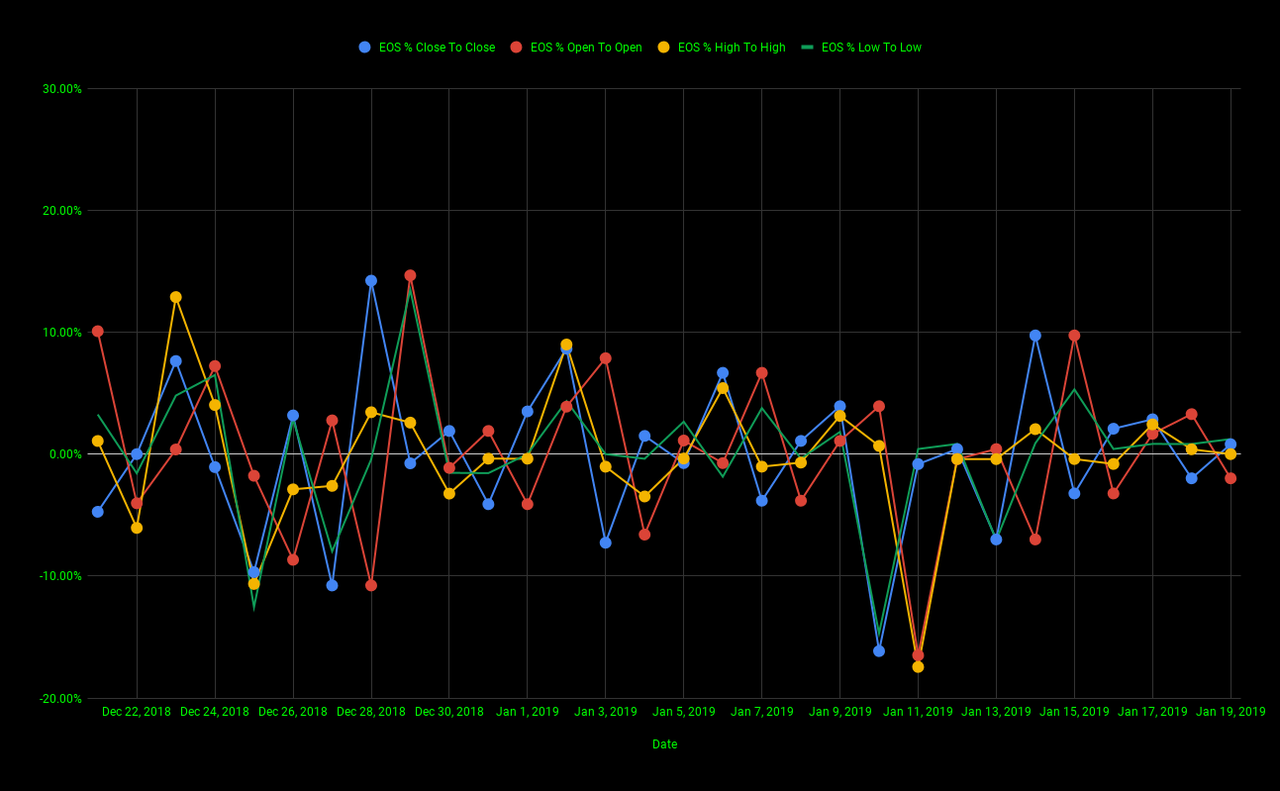
The chart below gives us a look at EOS's open (blue line), high (red line), low (yellow line), and close (green line) for the past 30 days.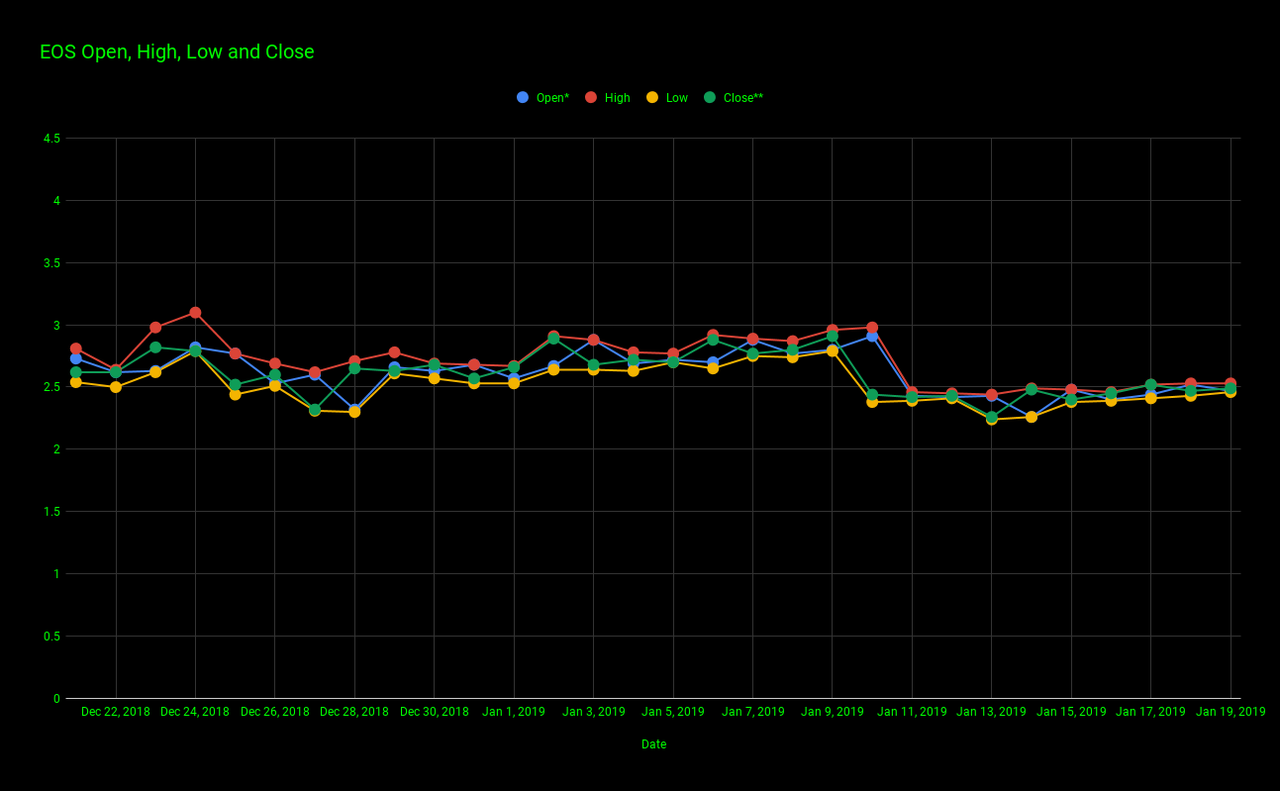
The chart below gives us a look at EOS's marketcap (blue line) and EOS's volume(red line) for the past 30 days.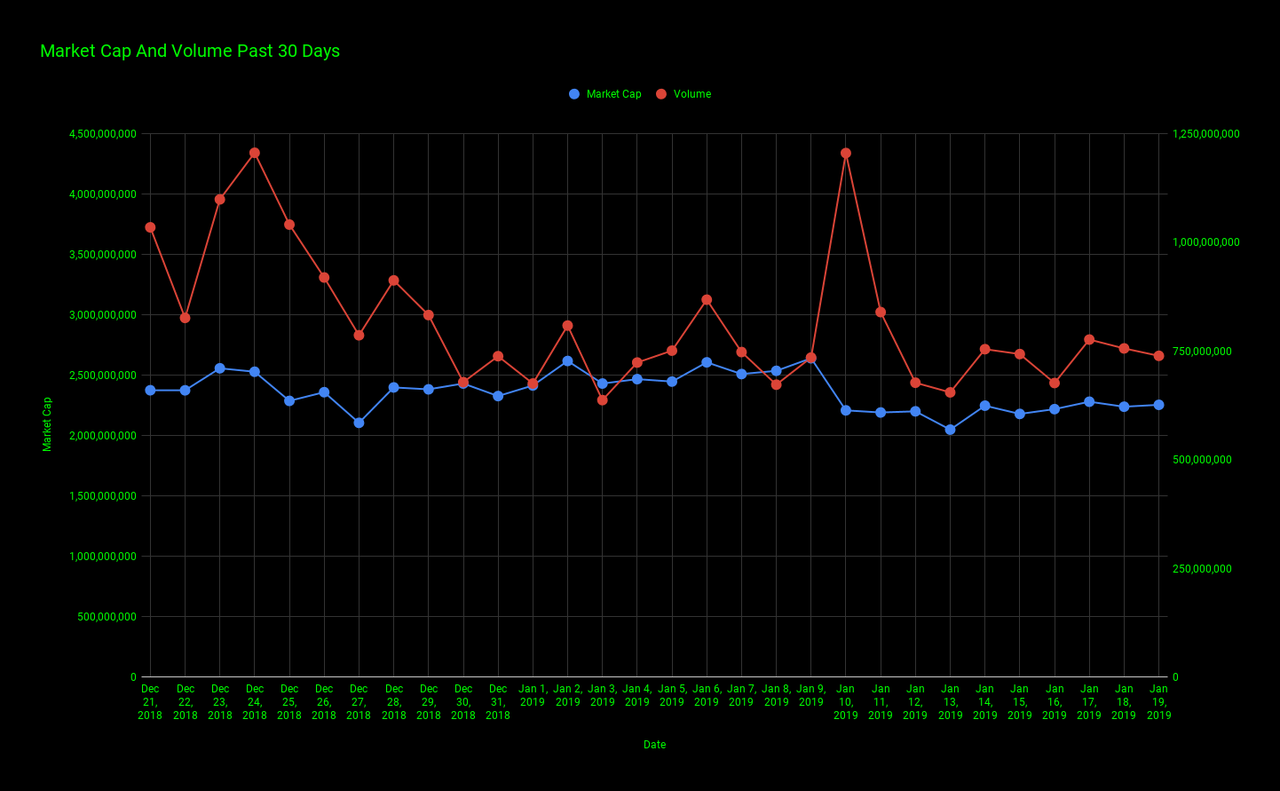
What about Cryptonite XCN?
Congratulations @cryptonite-elite! You have completed the following achievement on the Steem blockchain and have been rewarded with new badge(s) :
Click here to view your Board
If you no longer want to receive notifications, reply to this comment with the word
STOPTo support your work, I also upvoted your post!