*All credits to the master @haejin.
Summary of his video for those having trouble viewing it.
Looking at USD/TRX pairing, goto daily charts (1d) and look for patterns.
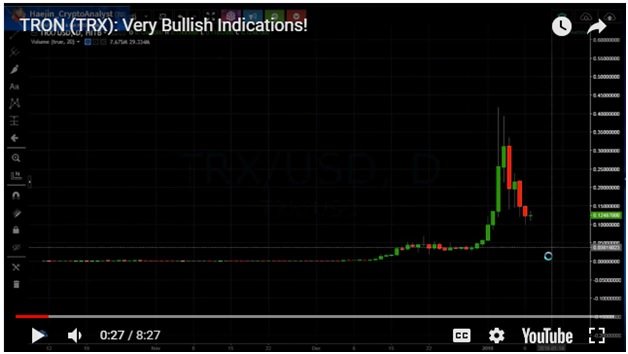
Then goto higher resolution (4hr).
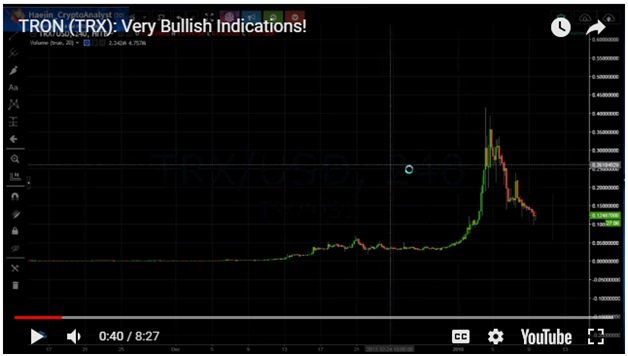
Goto genesis of the coin, looking for patterns.
When in doubt, draw some lines looking for patterns. This pattern, means there were a lot of sellers at the top. They kept selling and selling driving the price lower. Now the sellers are going away. That is why it becomes a contracting triangle. This contracting triangle can be bullish as sellers keep selling and selling until there are only buyers left, and then this explodes.
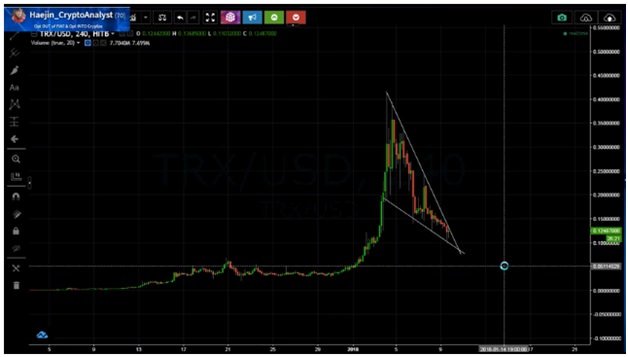
This pattern has a slingshot effect. Buyers are coming in, more and more, and it slingshots
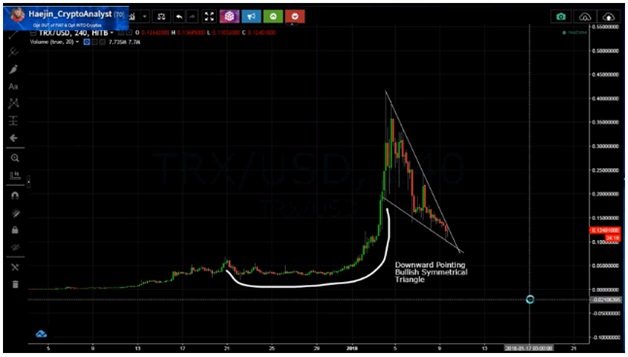
Now that the patterns are done, time for price analysis. Somewhere around the bottom of the symmetrical triangle will be the bottom.
Wave 1: The price will explode, almost vertical.
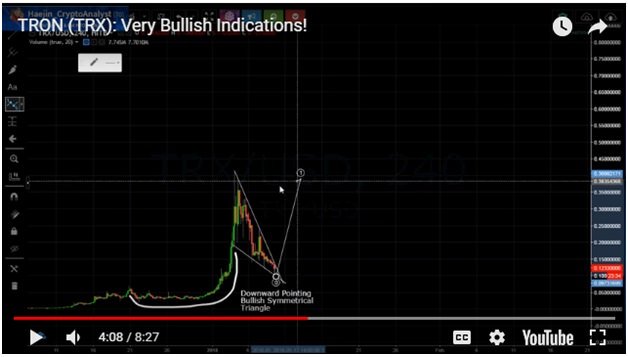
Wave 2: Retrace approximately 50% for wave 2.
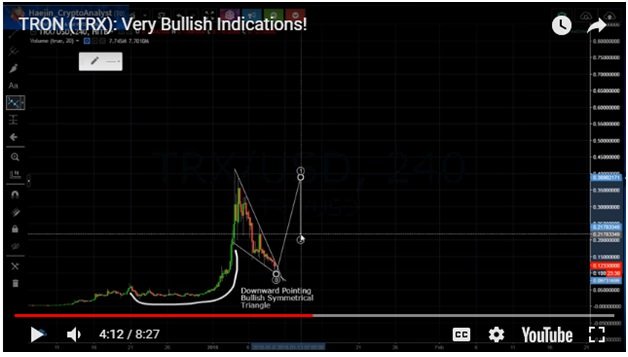
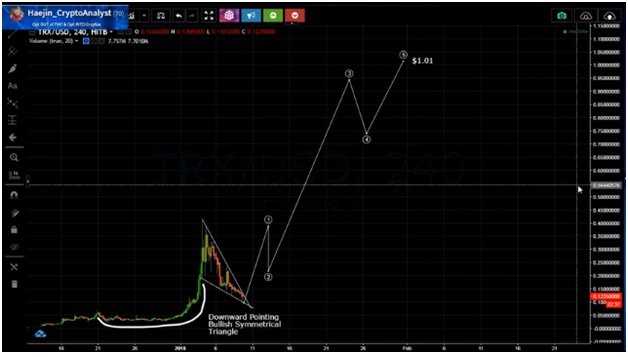
Wave 3: Will be about 2.618x of Wave 1.
Wave 4: Retraces about 38%.
Wave 5: When Wave 3 is extended Waves 1 and 5 trend towards equality of $1.01.
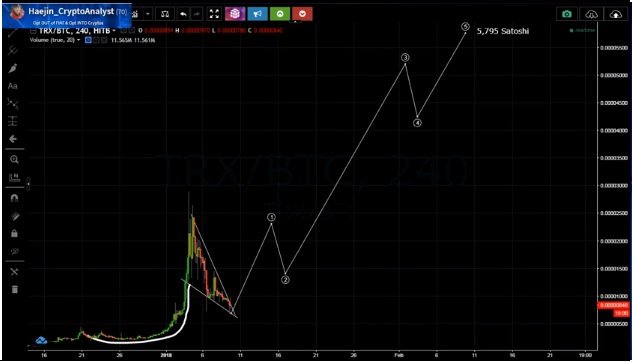
Next looking at TRX/BTC Pairing, the pattern is almost identical. When you get similar patterns, either USD or BTC pair, this is extra bullish.
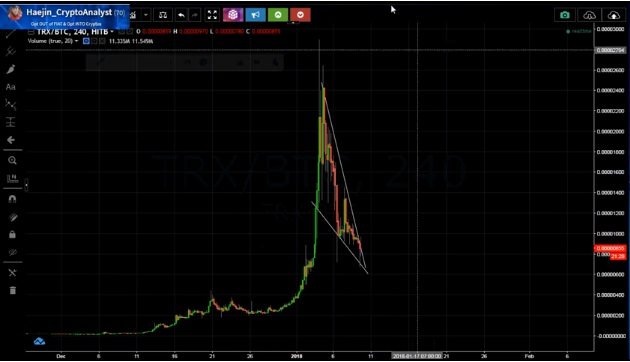
Draw the waves as you did with your TRX/USD pairing, will give you a price point of 5,795 Satoshi