The Bigger Picture on Gold, Without the Dogma – Pun Intended.

Ever get the feeling that gold is taking a siesta?
In my June 18 th articleabout the choppy dollar vs. gold, I mentioned this about the price action going forward…
"…We're also entering a seasonal low periodfor the metals that spans from the end of June to mid-July. The window for a potential move in the metals is just ahead, but caution is warranted for lower price points before a pivot upward…"
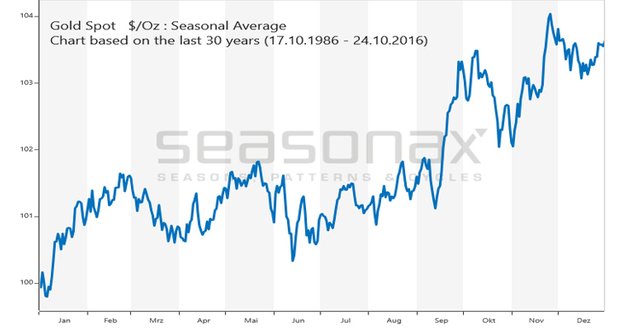
Graph courtesy of Seasonax
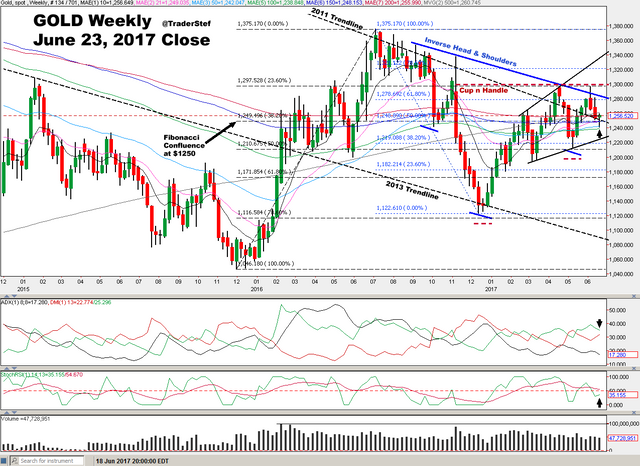
In my June 26 th article, I included the following gold weekly chart:
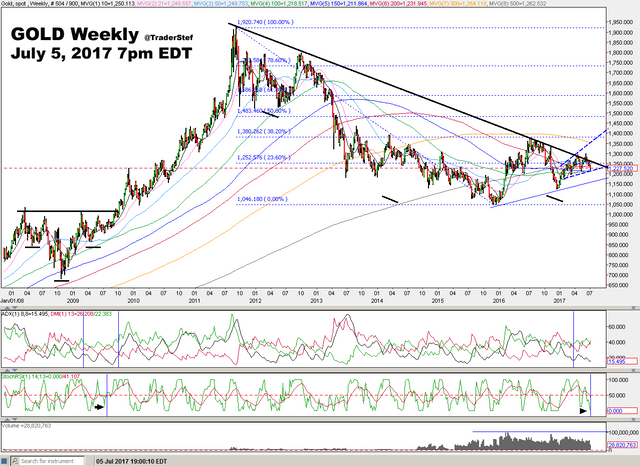
Let's step back and view the whole forest, instead of just trees.
In 2008-2009, a Continuation Inverse Head and Shoulders pattern can be seen with the classic horizontal neckline, which became the launch pad for a spectacular run to $1,920. Any neckline must first be decisively taken out with both price and volume for the next leg of a bull to sprint. What is different about the current pattern extending from the 2011 high to this week in 2017 is the length of time and downward slope of the neckline (and trendline, in this instance). We also have a smaller Inverse H&S within the right shoulder of this extended pattern, which adds more strength to the pattern.
Inverse H&S patterns can present themselves all over price trends, come in several shapes and lengths, and then there are classic Inverse H&S patterns with higher odds for an upward thrust. Do not summarily discount a pattern when it does not conform to your narrative or experience. Technical analysis is a process of watching and learning. The moment you insert a flavor of dogma, you're sowing the seeds of losing that edge against the next algorithm and candle.
_"All our references to the Head-and-Shoulders formations up to this point… have considered that pattern as typifying reversal of trend, and in its normal and common manifestation that is most definitely the Head-and-Shoulders function. But occasionally prices will go through a series of fluctuations which construct a sort of inverted Head-and-Shoulders picture which in turn leads to continuation of the previous trend." – Edwards and Magee,_Technical Analysis of Stock Trends 5__th Edition
During my recent interviewwith Crush The Street, I stated that I thought the trendline from 2011 will be taken out on the current attempts. Price has been chopping along since April, with the 23.6% Fibonacci at $1,252 as the medium price point. Let's see how the larger pattern plays out as gold enters its seasonal period of strength.
To close today's post, I highly recommend taking time to listen to Helene Meisler's (follow @hmeisler on Twitter) interview " On Good, Old-Fashioned Technical Analysis" with Jesse Felder over at the The Felder Report…
_"_Helene Meisler started her career on Wall Street when a career on Wall Street, let alone being a woman on Wall Street, was a contrarian move. She eventually found her way to working for trading legend Justin Mamis and has been charting the markets by hand (yes, that means pencil and paper) ever since…"
https://soundcloud.com/superinvestors/7-helene-meisler-on-good-old-fashioned-technical-analysis
Plan Your Trade, Trade Your Plan
TraderStef on Twitter
Crypto over gold. Crypto is rising. Gold went down.
Hopefully they don't start manipulating crypto the same way they do gold and silver.