Learning Technical Analysis #6 | Volume Indicator
I wrote in my first post on the Basics that Technical Analysis is a process where you ask questions painting a step by step picture of the psychology of the market. Basically you always want to look at the price and the trends first and as a secondary layer you want to use technical indicators to confirm this. Technical Indicators cal also help you to get in a bit early. There are many possible technical indicators and you don't want to use too many because they eventually will start conflicting. Trading just on these indicators alone can be very high risk and you want to use them complementary to price action and trends.
These are some of the most reliable indicators
- Volume
- Moving Averages
- MACD
- RSI
- Fibonacci
#6 Volume Indicator
Volume patterns are widely used and can be seen as essential when it comes down to identifying tops & bottoms along with confirming breakouts.
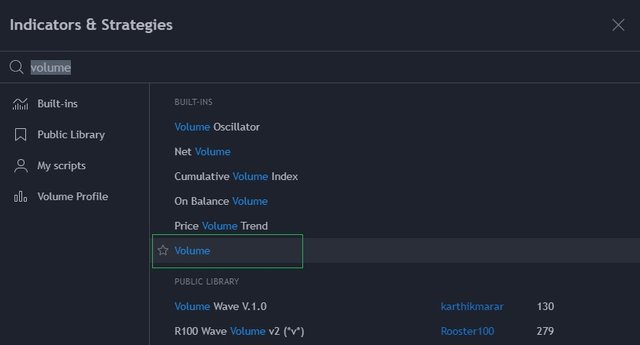
Adding Volume on Tradingview
If you want to add Volume in your Tradingview charts, you have to go to 'Indicators & Strategies' and search for Volume. By clicking it, you will add it to your own charts.
Volume Top & Bottom Indicator
Based on Volume action, it is usually possible to identify extreme tops & bottoms. Big volume candles are often the result of massive panic selling with a lot of buyers stepping in to pick it up at a cheap price. (or Fomo buying with a lot of sellers stepping in to take profit).
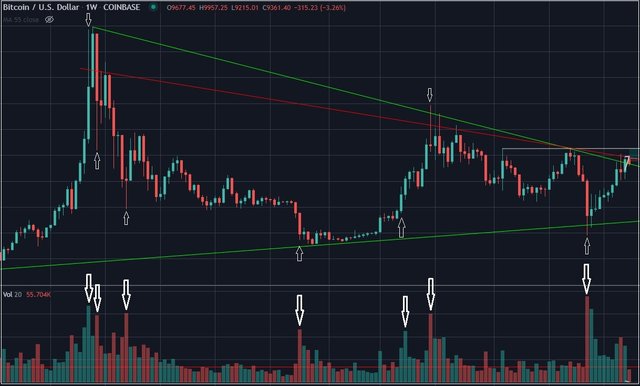
Looking at the Bitcoin weekly chart this perfectly adds up as literally all tops & bottoms are signaled by a high spike on the volume indicator. Especially on the longer-term timeframe, the volume is an excellent indicator.
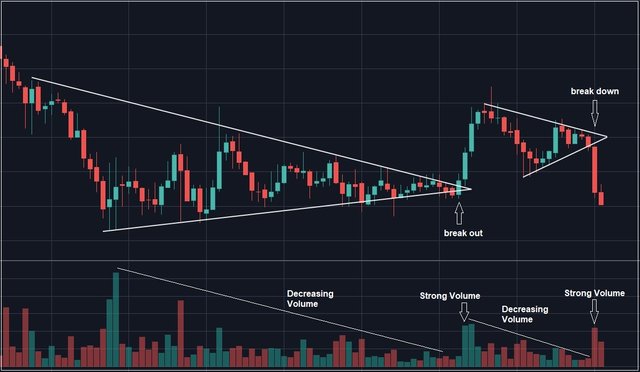
Volume Breakout Indicator
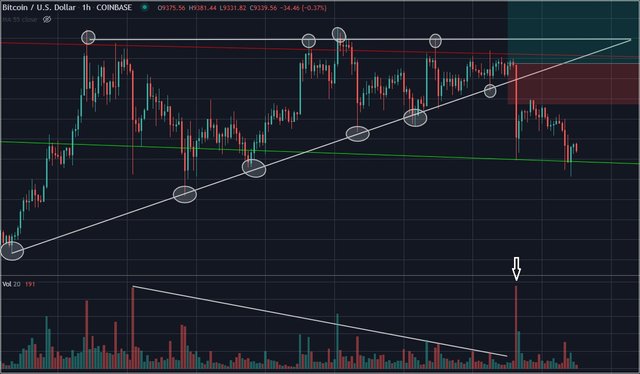
Volume itself can be seen as a pattern and the volume bars come in very handy when they break out of their pattern (low bars followed by a much bigger volume bar). When both the price and the volume are in a very narrow range and the price does break out of the triangle, the volume often doubles or triples which confirms the breakout making it quite strong as there is weight behind it. The same move without a volume spike wouldn't nearly be as strong.
I already mentioned this in my post on symmetrical triangles. When Volume goes down and the price is trading in a narrow range, the breakout tends to be quite strong when it's confirmed by a stronger volume.
In my Documented Trade yesterday on Bitcoin (Link) it was the exact same scenario. When it started to break down, the volume spiked followed by an even bigger drop.
Low Marketcap Coins
Using Volume Indicators & Technical Analysis on lower market cap coins is often not all that useful because very little money is usually needed to move the price and often times volume is manipulated in order to draw attention or to stay listed on certain exchanges. SCR which has a 200k market cap being listed at 2 exchanges is a good example. Trading bots are usually running to create fake volume while real buy or sell orders make the price shoot up or down even with very small amounts. Buying 15$ worth of SCR currently would make the price shoot up by 25%. It's also clear to see in the chart when the trading bots stopped trading.
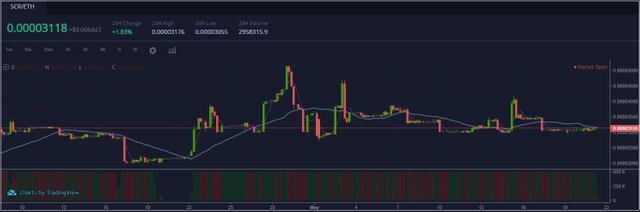
So by all means, stick to higher market cap coins when looking at technical indicators as they have a lot more weight to them.
Previous Technical Analysis Lessons
Technical Analysis #1 | Basics
Technical Analysis #2 | Trends
Technical Analysis #3 | Bearish Patterns
Technical Analysis #4 | Bullish Patterns
Technical Analysis #5 | Symmetrical Triangles
Future Articles in this series
Publish0x | Costanza Technical Analysis
Free Software I use for Charts
Tradingview
|
|
|
|


