PRICE FORECAST FOR BITCOIN (BTC/USD ON BITFINEX)
Hello guys,
I'm sharing my own technical analysis and price forecast for the coming weeks and what to expect from bitcoin. Well, we're seeing a major price correction after a parabolic movement and bitcoin still looks bearish to me for now. Kindly check the picture below which clearly shows what happened and what's more to come.
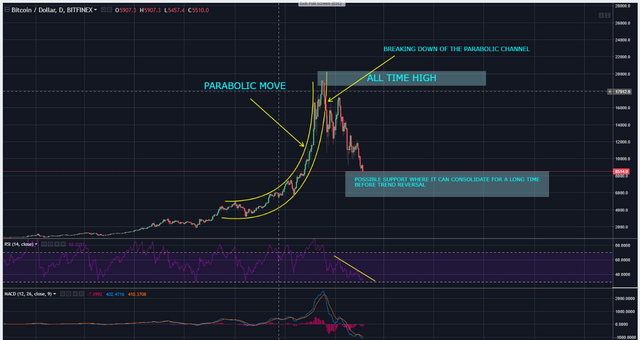
As we can see, after breaking down of the parabolic channel, price correction has taken place and we're yet to see a bottom from here. $10500 for now looks like a resistance and we can see further downside to the $5500-$6000 area if we don't get any good fundamentals. Although the RSI is close to oversold but there is still no sign of reversal.
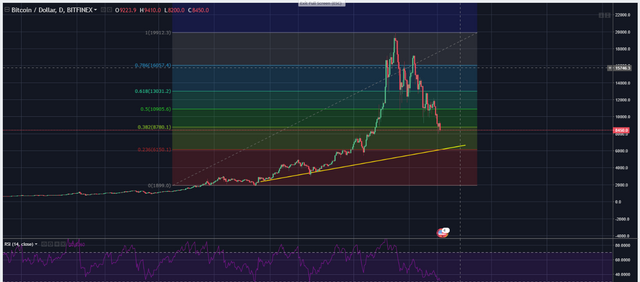
If we draw a Fibonacci on the daily chart, we can see that there is already a 63% price correction done as of now but it has also broken down the fib 0.382 level and there's high possibility of testing the $6k area which is the 0.263 fib level.
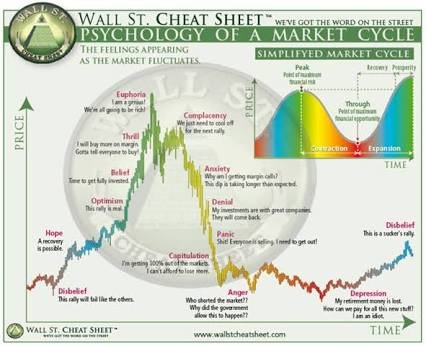
I'm also uploading a very common picture that is know as "wall street cheat sheet" and surprisingly, bitcoin is moving very similar to this sheet. I don't guarantee that bitcoin is going to follow the same movement as given in the sheet but so far it has been doing it perfectly.
Please note that this analysis has been done on a daily time frame chart. Day traders can still trade and earn profits from the price movements on shorter time frames.
DISCLAIMER : THIS IS NOT A FINANCIAL ADVICE BUT THE BEST POSSIBLE PRICE FORECAST ACCORDING TO US. PLEASE DO YOUR OWN RESEARCH BEFORE TAKING ACTIONS.
Join our YouTube channel where we will be uploading our very first video soon : https://www.youtube.com/channel/UCmYU8s_HUO2QYGQAERASMWA
Our official telegram : https://t.me/joinchat/HV9ggw-FUt1cOiwX_n7qow
We share daily trading signals for scalpers here.
Our official twitter handle : Check out Coin Authority (@CoinAuthorityOG): https://twitter.com/CoinAuthorityOG?s=09
Analysis on btc done by @coin authority is too good .I want an opinion from you that when is the right time to buy btc? According to the graph you uploaded it shows a downtrend and can go down further so give me an opinion at which point the uptrend will start to grow?
The parabolic curve which you had drawn in the graph always reluts in downtrend or is there any particular reason of the downtrend?plz explain
Hi @cryptoaid, thank you for the comment. As shown in the graph, we can see the market nicely following the technical movement of Bitcoin. Hence, we can say that the break-down of the parabolic movement is also one of the reasons for the bearish movement of bitcoin as majority of traders are on a bearish side. Furthermore, Bitcoin has been attacked many times by big firms (Jamie Dimon is one of the examples) that caused FUD in the market. Recently, we have also seen the USDT (Tether) FUD in the bitcoin space that caused BTC to drop further. Let's wait and see how this turns out for us and if we get to see some good news in the market, then only we can expect a trend reversal but for now the graphical representation shows otherwise. Let us know if you have more questions.
UPDATE
As we predicted just yesterday, bitcoin came down to $6k-ish zone and went up (currently trading at ~$7300). Please note that bitcoin is still bearish and there is no sign of reversal yet. We're expecting further lows to $5500-$6000 zone in the coming weeks. Stay tuned for more updates!