- Explain Rectangle Pattern in your own word.
- How to identify Rectangles. Explain with Screenshots.
- Can we use indicators with this pattern to get accurate results? Explain with Screenshots.
- Explain Rectangle Tops and Rectangle Bottoms in your own words with Screenshots of both patterns.
- Show full trade setup using this pattern for both trends. ( Entry Point, Take Profit, Stop Loss, Breakout)
- Conclusion

Explain Rectangle Pattern in your own word.
The price is trending and the traders are gathering up momentum, pushing the trend further up/down when suddenly theres a consolidation at one point, price is moving sideways, not up or down, and then you're a little confused, what's happening? What's about to happen? Where will price go? You must have been here right? Well me too. Let me tell you about it.
It is a well know fact and principle that a trending market, be it a bullish or a bearish one, doesn't move in a straight line upwards or downwards but move in a zigzag motion. Over time, some patterns tend to form which we have come to recognize and label accordingly. One of this patterns, The rectangle pattern, is what I'll be talking about today.
Rectangle pattern
We know that when a price trends upwards, the bulls are mostly in control and the reverse is the case when a market is trending downwards, bears have taken over. This is not the whole story though, there are times when neither the bulls nor the bears are in absolute control and price tends to move in a horizontal motion in a particular region of the chart. This is the rectangle pattern.
So what exactly is this rectangle pattern? Well in simple terms, its a period of indecision between the buyers and the sellers leading to a, somewhat, horizontal price movement and looking closely you'll see that the tops and bottoms of this pattern test a particular region and bounces back the opposite direction. If you draw horizontal lines at the top and bottom, you can easily get the **Rectangle pattern**.
How to identify Rectangles. Explain with Screenshots.
To spot a rectangle, I'll just put you through using the three main characteristics of a rectangle pattern
Horizontal price movement
This is so true with rectangular patterns as price will move horizontally for a while before an eventual breakout. This is so because of the indecision of traders, buyers and sellers alike which will lead to a consolidation of the price.
Test and Retests.
Well when i said price will move in a horizontal fashion, i didn't mean a straight horizontal line, there will be zigzags of ups and downs, but when you look closely you can easily spot that the prices are generally in a region and keep bouncing off this region time and time again. If you can't see this ordinarily, you can simply draw a trend line to see more clearly where prices are testing.
Even distribution of highs and lows.
Well just because i said price will test a region, bouncing off the support and resistance lines doesn't mean it should be just one test, nope,this is wrong. The highs and low points of the rectangular patterns should be spread out across the whole rectangle. In my opinion, and that of many other experienced traders, I think the rectangle pattern should have at least 3 points where the price bounces off the support and resistance levels.
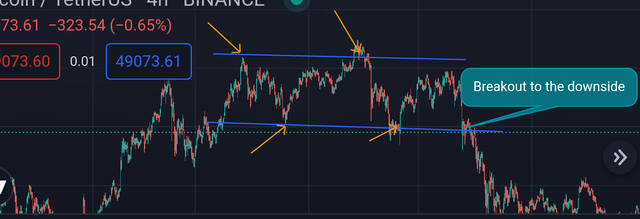
A typical rectangle pattern. Price tests and retest the boundaries while moving in a horizontal fashion, the tops and bottoms qre evenly spread across the length of the rectangle and then there's and eventual breakout of the price from the rectangle.
Can we use indicators with this pattern to get accurate results? Explain with Screenshots.
I totally think this pattern can work well with indicators, I tested it personally with one of the indicators, The Bollinger bands, it was not entirely perfect but it gave a good result.
Before talking more on how the indicator and the rectangular pattern aligned, let me give you a brief general insight in the Bollinger bands principle. The bollinger band was developed by John Bollinger. It consists of three lines, the upper line, the middle line and the lower line. The upper and lower line are the standard deviation while the middle line is the simple moving average. The simple moving average works just as the normal one we have while the bands (upper and lower lines) work to show the market volatility; when there's low volatility and the market isn't trending, the bands contract/squeeze, while they expand when there's high volatility in the market.
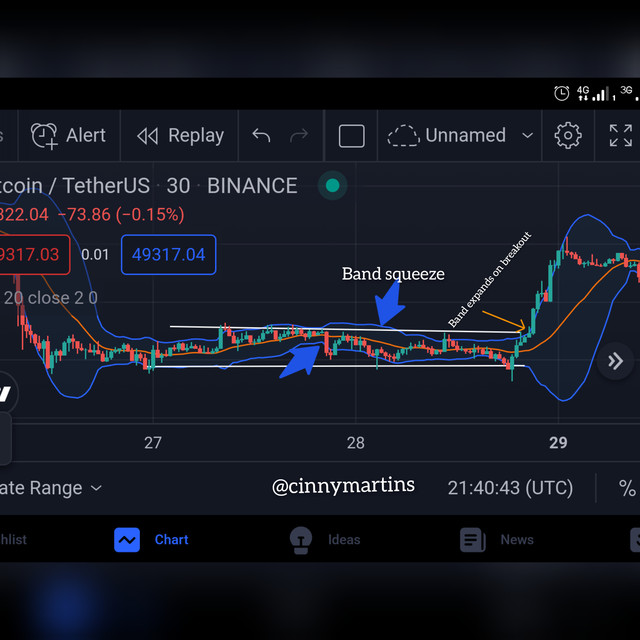
As we can see here, the bollinger band squeezed where we have the rectangle pattern, both indicating a period of indecision of traders and therefore low volume and volatility. When a decision was reached by the traders as to whom gains control of the market, bulls or bears, a break out happened, and it was to the upside, the bulls took over. The Bollinger bands also expanded showing high volatility of the market.
Explain Rectangle Tops and Rectangle Bottoms in your own words with Screenshots of both patterns.
Rectangle Tops
I'll simply put this as the consolidation of price in an uptrend. It seems as though the bulls/buyers are trying to catch their breath. This typically occurs at the top of an uptrend. Traders are not sure as to where the price might go next, will it be a continuation or a reversal? Who knows. Well wise traders simply wait for a breakout.
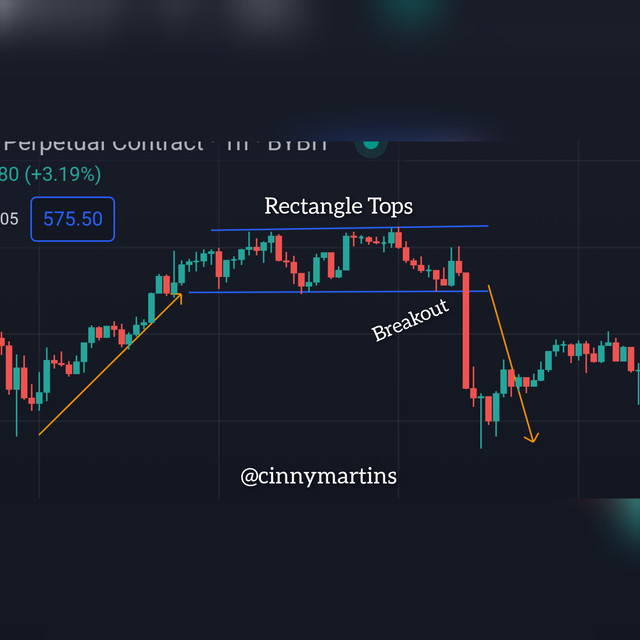
As seen here, price was clearly in an uptrend and moving pretty well until the period of indecision, which leads to the formation of a rectangular pattern at the top of the trend, after a while. The market broke out of the rectangle.
Rectangle Bottoms
Well this is quite the opposite of the tops, literally. The price consolidates at the bottom of a downtrend. Sellers are taking break it seems, and buyers are seriously considering if its time to enter the market and push up.
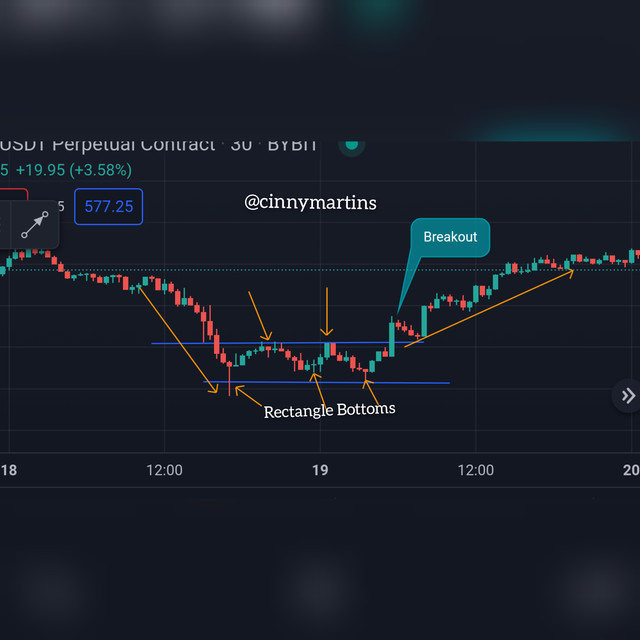
Seeing that the price has been on a trend, a period of consolidation was confirmed by the rectangular pattern characterized by the horizontal price movement at the bottom of the trend.
Show full trade setup using this pattern for both trends. ( Entry Point, Take Profit, Stop Loss, Breakout)
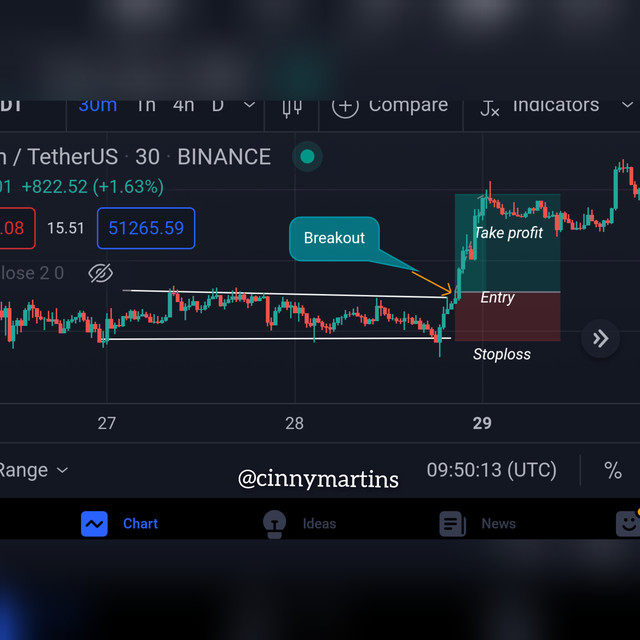
Buy setup. From the image above we can see a clear rectangular pattern formed with the price testing the support/resistance levels a few times before a break out. A typical entry into a trade with this pattern will be to enter just after the first breakout candle and the set our stoploss just below the support line and a take profit a few candles above the resistance line.
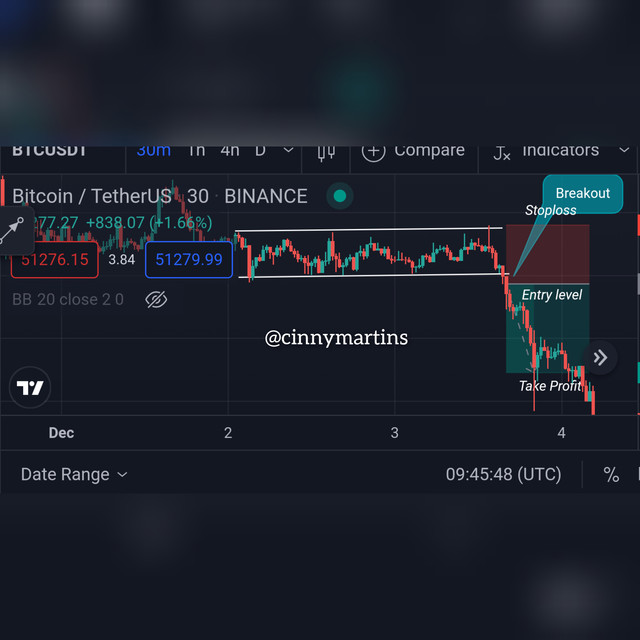
Sell set up. Here we see the rectangular pattern formed indicating some sort of indecision and a good opportunity for a trade shows up when the price eventually breaks out of the rectangle. We enter the trade after the breakout, and then set the stop loss order just above the and the take profit just a few candles the the support level
Conclusion
Well its been a horizontal fun ride. I've had my knowledge expanded into more knowledge by this wonderful lecture. I learnt in this lecture that;
- Rectangular patterns are patterns bounded by two, nearly horizontal lines with prices test and retesting the boundaries evenly.
- It forms due to indecision of traders, bulls and bears alike.
- Waiting for a breakout before entering a trade is the best option. You can't be sure of the next price movement.
- Entering a trade using this set up is now easier.
- It can also work well with indicators, although not entirely perfect.
Thank you.
Cc.
@sachin08