Using Fibonacci Retracements to determine trend changes.
Greetings to all readers of this great platform, especially to those of the #ProjectHOPE community, in this opportunity I come to share with you information regarding operations in trading, using a well-known technical indicator called "Fibonacci Retracement" which is mainly used to determine the trend changes in a market, either bullish to bearish or vice versa, this helps us make decisions to invest or withdraw our investment from the market, at the time that this confirms a change in trend.
 The image used is from Public Domain, Author: Gerd Altmann, 2015 |
|---|
To understand a little more about Fibonacci Retracements, it is necessary to know that it is a technical indicator based on mathematical calculations, which generally work to determine the behavior of a graph determining the corrections or setbacks that this may have in the future, it is applicable in any temporality that we want to apply, and works in both directions, i.e. bullish and bearish market.
There are certain peculiarities for the application of Fibonacci Retracements, and several concepts that must be understood before applying it, among which we must take into consideration what is known as the golden ratio, and can be identified as the time at which the action or change in trend is confirmed, and this applies in both bearish and bullish markets, for a better understanding in the application of it I will show its application in 2 graphs, one with uptrend and one with downtrend.

 Screenshot taken at: Binance |
|---|
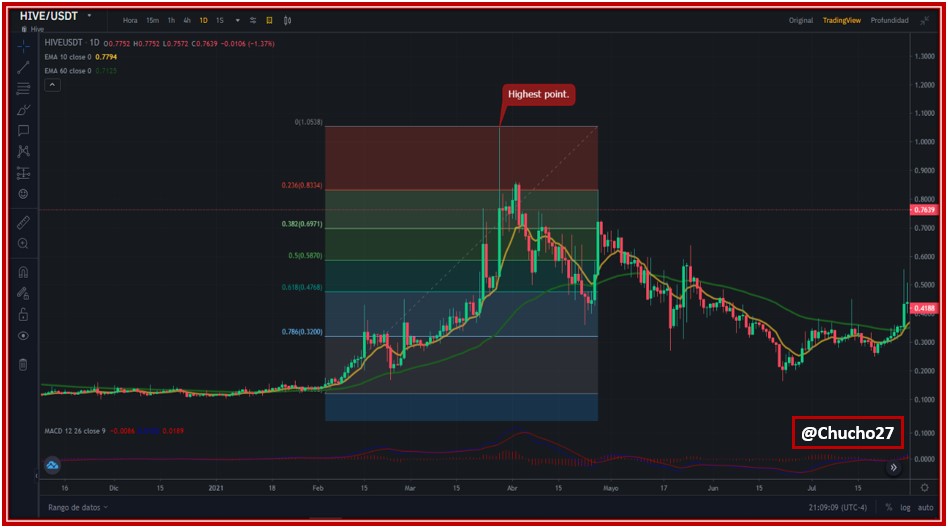
When plotting the Fibonacci Retracement in an uptrend, it is necessary to determine the lowest point of the price, which will be the starting point, to the highest point reached by the market price, in the time we want to study, this will generate a series of horizontal stripes of various colors, which will be represented as the supports that will have the market price at the time of making its change of trend, as shown in the chart below.
 Screenshot taken at: Binance |
|---|
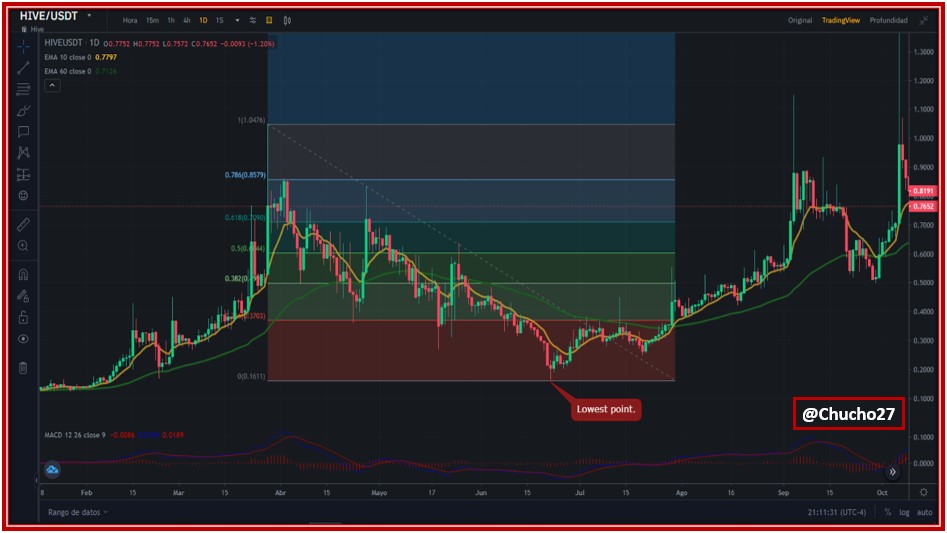
On the contrary, when plotting the Fibonacci Retracement in a downtrend, it is necessary to look for the highest point reached by the market price, which will be our starting point for the Fibonacci plot, and then we look for the lowest price point, in the period we want to study, this will also show us a series of colored stripes, which will be represented as the resistances that the price must overcome when there is a change of market trend, as shown in the chart below.
As it could be observed, the technical indicator of the Fibonacci Retracement, is a very useful tool, which can help us to determine the future trend changes of a market, in the same way to plot this indicator, we will have a clearer view on the supports or resistances in the market depending on the case of the market, ie in bullish or bearish market, with the application of this technical indicator we can begin to understand a little better the behavior of the market we are studying, and will help us make better decisions in conjunction with other indicators.


Hi @chucho27.
Very interesting the technical considerations you share with us about the use of Fibonacci retracements to determine trend changes in the price of cryptocurrencies, although in particular I am more inclined to fundamental analysis.
Greetings and thanks for your contribution.
Hello @chucho27, I remember that a few weeks ago I did a homework on "Fibonacci" in the Steemit crypto school, it was really fascinating to identify the market trends with this tool, and I was left with the impression that you have to put a lot of practice and a lot of attention to master it with the naked eye and To become an expert, trading is something fascinating.
Greetings friend @tocho2 I share your opinion 100%, it really is fascinating the world of trading, it is not something you learn from one day to another, requires much study and time dedicated to learning, personally I think that trading has cost me more to learn it than my 2 university careers hahahaha, thanks for your comment.
Hello @chucho27
A few weeks ago I tried to get into studying this indicator, however I did not finish understanding it, I did not spend enough time on it. But I know it is widely used by many traders.
I think it is worth learning how to use it.
Greetings friend @josevas217, I really have some time implemented the Fibonacci, to try to understand more of it, but it has so many utilities that it really is difficult to learn to use it, or to me personally it has cost me, thanks for your comment.
Hello dear friend, this indicator has always caught my attention, when I did the forex course we did not see it but I know that many people use it. It would be good to learn more about it. Greetings friend, excellent information.
Hello my dear friend @chucho27, what a good article some time ago I tried to study this indicator but it was a little difficult, thanks for the detailed and concrete explanation at some point I will encourage me and start again to investigate about it. See you later, have a great weekend.
Greetings friend @amestyj, if it is a little difficult to learn it, I have time trying to learn about it, I still feel that I am missing many things to know, but little by little you are learning, you have to keep putting effort to the world of trading, thanks for commenting.