Effective Trading Strategy using Line Charts -Steemit Crypto Academy | S6W1 | Homework Post for @dilchamo

1 Define Line charts in your own words and Identify the uses of Line charts.
A line chart can also be referred to as a line graph which usually exhibit all informations as a sequence of points in a data which is known as Markers which is connected via a line segment. This line is extremely very easy and the most convenient chart for begginners because of how simple is easy to read even though it doesn't have all the required information on the chart concern price movement but it.
In other words, a line chart gives remarkably a lesser information about the price of an asset in the market simply because it is use to join only the closing price of that particular interval
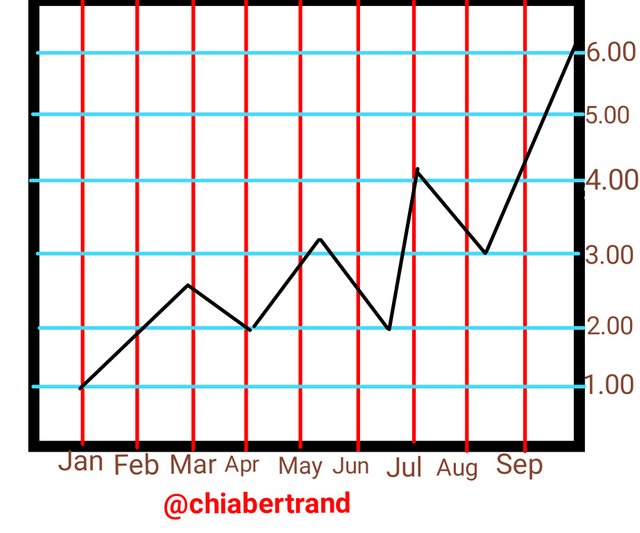 Image design by me via iMarkUp
From the image above, we can deduced that it's a line chart because we see a series of points created by connecting them with a straight line in the chart. We can use this line chart to create changes
We also see how it's very easy to understand because it gives only the assets closing price as time changes and this helps to minimize noise from both the open, low and high price of an asset in trading days
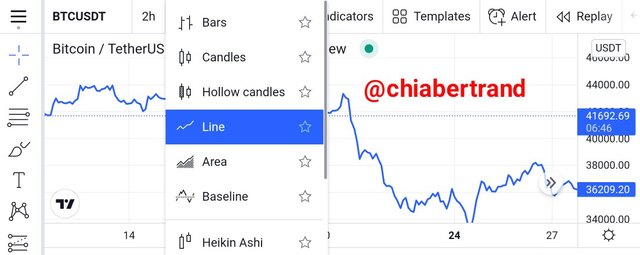
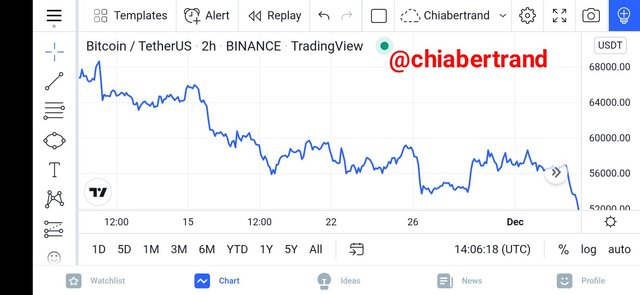
Screenshot taken from tradingview.com
The BTCUSD chart above shows a clear representation of a line graph which traders can easily add and then interpret the chart with less difficulties
Uses of line chart
1): Line charts are usually used to visualize the trend of data over time intervals
2' Line charts are usually use to record changes over Both Long and short time frames

2. How to Identify Support and Resistance levels using Line Charts (Demonstrate with screenshots)
Traders can easily identify support and resistance levels when using a line chart simply because the line chart connects only the closing price with most of the information on the chart. Traders should know that this two areas are extremely very important to identify because this are the areas they can take home huge profit after placing a sell short position or buy Long position after knowing how to utilize their risk-management tool. There is usually very high selling/buying pressure in this area which is important for traders to know and identify at the earliest stage in the market.
Identifying Support level using a line Chart
In other to identify the support levels using a line Chart, we should know that at any point where a resistance is broken it definitely forms a support at that level or we should also know that the support level is usually form when the price of any asset can be stopped any where there is a strong buying power which enables the asset price not to trend futher downward again. When this is seen, we can now see how a new level of support is located just above the last range of trading level of resistance.
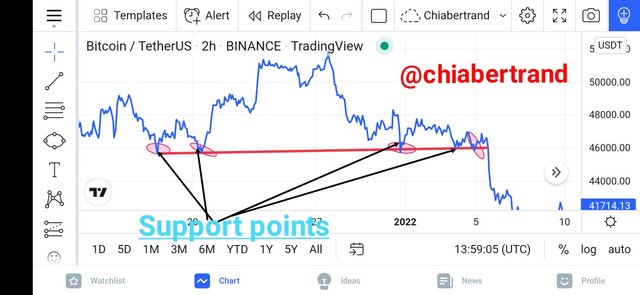
Screenshot taken from tradingview.com
This level of support usually serve as the level of high supply where large buying occur in the market as traders can take home enough profit if they have appropriately identify this area. Why huge buying occur at this level is simply because the price is usually expected by traders to reject this level. However, price may as well break at this level and form a resistance level if only there is a very strong bearish movement in the market. If traders can use their risk management skills at this level, they could make large income after taking good selling trades positions.
Identifying Resistance level using a line Chart
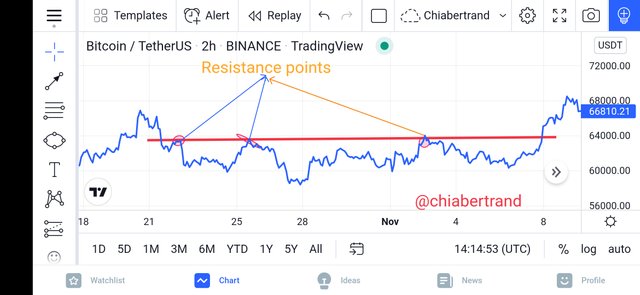
In other to identify the Resistance levels using a line Chart, we should know that at any point where a Support is broken it definitely forms a Resistance at that level or we should also know that the resistance level is usually form when the price of any asset can be stopped any where there is a strong selling power which enables the asset price not to trend futher upward again. When this is seen, we can now see how a new level of resistance is located just below the last range of trading level of support.
Screenshot taken from tradingview.com
This level of resistance usually serve as the level of high supply where large sell off usually occur in the market as traders can take home enough profit if they have appropriately identify this area. Why there is a large sell off here is simply because the price is usually expected by traders to reject this level and this level may break and form a support level if only there is a very strong bullish movement in the market

3 Differentiate between line charts and Candlestick charts.( Demonstrate with screenshots)

BTCUSD Line chart taken from tradingview.com
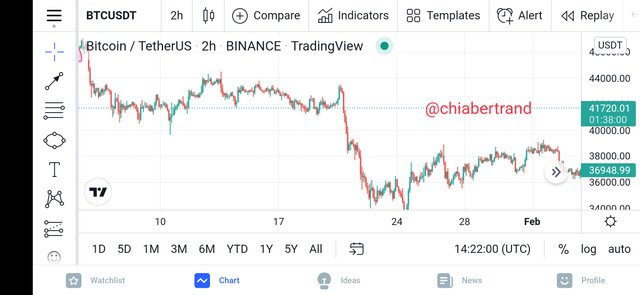
BTCUSD Candlestick chart taken from tradingview.com
| Line Charts | Candlestick Charts |
|---|---|
| It gives a lesser information about the price of an asset in the market simply because it is use to join only the closing price of that particular interval | It gives the most information about the price of an asset in the market |
| It is very easy for trades to read and understand it and relatively good for beginners | It is extremely very difficult to interpret it and only advance and pro traders can read it |
| It is very easy to make profit in it when trading since it's not difficult to interpret | It is very difficult to make profit in it when trading since it's difficult to interpret at times by traders |
| All technical analysis can't be carried out here simply because it doesn't have enough information concerning price of an asset | All technical analysis can be carried out here simply because it have all information concerning price of an asset |

4. Explain the other Suitable indicators that can be used with Line charts.(Demonstrate with screenshots)
A good indicator I will be using here is the Moving Average indicator (MA) to identify both trend reversal pattern and support and resistance levels since the MA can be use to easily identify both support and resistance in a chart.
Trend reversal pattern using MA
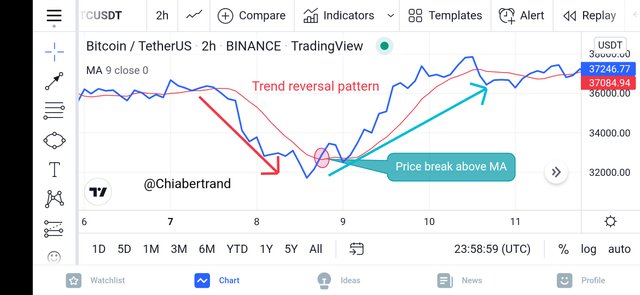
In a trend reversal pattern, when ever the asset price is trading below the MA line, it tells traders that the asset is moving downtrend and in a scenario when when ever the asset price is trading above the MA line, it tells traders that the asset is moving uptrend. Now, trend reversal usually occurs when ever the asset price break above or below the MA. When ever this phenomenon occurs, traders will have a good opportunity to start placing early entries in the market so as to maximize profits and minimize losses by taking either long positions for buy or Short positions for sell
trend reversal pattern taken from tradingview.com
In the BTC chart above, we can see clearly how price started trading below the MA indicating a downtrend there after, when the asset price suddenly break the MA line, it indicated a price reversal there by trading above the MA in an uptrend movement. At that particular point of breakage, traders could take early Long position entry so as buy the asset at the early stage of the market and make enough profit afterward
Identifying support and resistance using MA
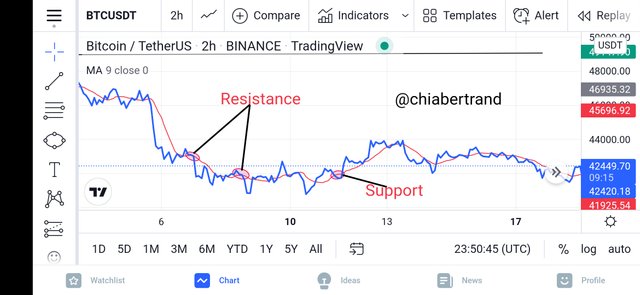
Identifying both support and resistance using MA is relatively very simple because at any point in a trending market, when ever the MA touches or crosses the asset price, we could identify if it's either a support or resistance point depending on the trending movement of price. When it touches or crosses this positions, it will still continue in it's original direction either uptrend or downtrend. This will now depend on traders to either take long or short positions in a particular original direction depending on the initial direction
Identifying support and resistance from tradingview.com
From the BTCUSD chart above, we see how during an uptrend, the price of BTCUSD will retrace below to that of the line of the MA so as to look for a trend continuation after when it has looked for a support. In a scenario, we see how during a downtrend, the price of BTCUSD will retrace above to that of the line of the MA so as to look for a trend continuation after when it has looked for a resistance.

5. Prove your Understanding of Bullish and Bearish Trading opportunities using Line charts. (Demonstrate with screenshots)
In a Trading market, all traders that wishes to maximize profits and minimize losses should definitely know how to identify both bullshit and bearish trend movement in the market so as to know how to take perfect entry points for either buy or sell positions. So in this question, I will be showing my understanding on how to identify both buy or selling points in ascending or descending triangles.
Bullish Trading opportunities using Line charts
We can use an Ascending Triangle with a line Chart so as to identify bullish trading opportunity at any point we can be able to identify a continues higher high moving downward . When we fine out this, the next thing is that a very strong bullish signal moves uptrend together with asset price at a relative longer time after price reversal from the Ascending Triangle
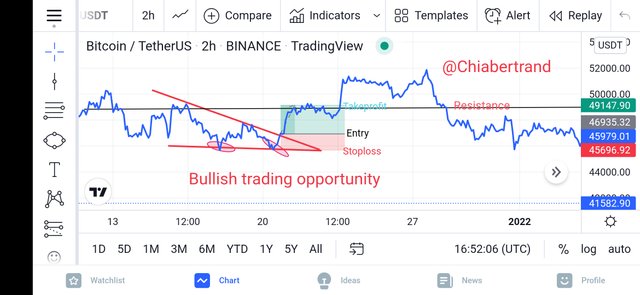
Screenshot taken from rradingview.com
From the BTCUSD chart above, we see how price moves down gently forming higher highs then eventually start moving up rapidly after a price reversal pattern from the triangle
Bearish Trading opportunities using Line charts
We can use Descending Triangle with a line Chart so as to identify bearish trading opportunity at any point we can be able to identify a continues lower highs moving uptrend. When we fine out this, the next thing is that a very strong bearish signal moves downtrend together with asset price at a relative longer time after price reversal from the descending Triangle
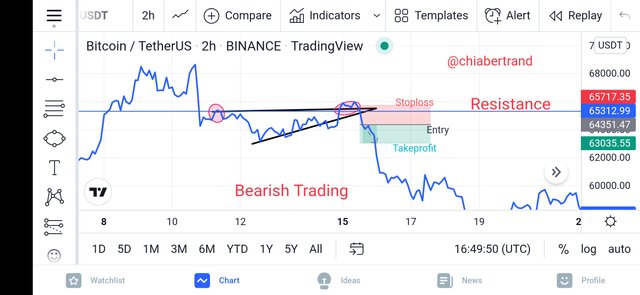
Screenshot taken from rradingview.com
From the BTCUSD chart above, we see how price moves up gently forming Lower highs then eventually start falling down drastically after a price reversal pattern from the triangle

6. Investigate the Advantages and Disadvantages of Line charts according to your Knowledge.
| Advantages of Line Chart | Disadvantages of Line Chart |
|---|---|
| It usually connects only the closing price with most of the information on the chart which makes interpretation very easy for traders | The information provided on a line chart is usually not enough for traders to carry out good technical analysis hence may hinder them not to make enough profit and may still end up not making profit |
| Traders can easily identify support and resistance levels when using a line chart as the line chart will filter out noise from the market. This will help to know when to sell or buy any crypto asset by making huge profit from the trade | The line chart is disadvantageous to a trader because a broad collection of all the previous data is usually needed in other to disclose all the information in the market which is extremely very difficult because it connects only the closing price of the asset |
| A line chart is extremely very easy to read and interpret by traders even the beginners since it connects just the closing price to the data points | The line chart is disadvantageous because only long term traders can benefit from it since it requires only high timeframe in other to carry out effective trading which is disadvantageous to short term traders that trade using short time frames because it may generate alot of noise |


So far I have been able to understand very well what is a line chart and it's uses to Crypto traders, also I was able to give the differences between a line chart and a candlestick chart. I was also able to use the line chart to identify very easily both support and resistance levels in the market and I gave a good description of using a line chart together with a moving average indicator.
So far I have seen that a line chart is extremely very easy for all traders even including beginners to read and interpret data information on a chart since it connects just the close with all the information on a chart. Never the less, a line chart doesn't contain all information on a chart which makes it difficult for a trader to carry out proper technical analysis in other to bring out large profit from it since it doesn't connect points like open, high and low.
Thanks so much Professor @dilchamo for this wanderfull and excellent lectures because I have been able to grabbed so much knowledge from this this effective trading strategy using a line chart
CC:
@dilchamo