[Crypto Trading Using Zig Zag Indicator]-Steemit Crypto Academy / S6W1 - Homework Post for @kouba01

1. Show your understanding of the Zig Zag as a trading indicator and how it is calculated?
Understanding The Zig Zag Indicator
The Zig Zag Indicator is not a difficult indicator for traders to read and understand and this indicator is a highly profitable indicator if traders can be able to interpret it appropriately because it's use to understand the trend of price in the market. This indicator is extremely important for traders because it's use to filter out little or micro price movement in the market so that traders can identify trends at different time frames
The Zig Zag Indicator is usually use on a graph to plot points anytime there is a price reversal. straight lines are usually drawn at this points by ensuring a bigger percentage of a predetermined variable. This indicator usually bring down the impression of any fluctuating price of a crypto asset because it is usually use to watched out for any changes in price of crypto assets and this indicator also lowers the rate of noise disturbance in the crypto market hence making traders to be able to interpret and take good entry positions in the market and this indicator work best in a very strong trending market either in a bullish or bearish movement
When ever there is a price movement in the market, the Zig Zag line will then show up between a swing low and high which is usually considerably greater than the describe percentage which is most oftenly 5%.
How the Zig Zag Indicator is Calculated
I will be showing my understanding of how to calculate this Indicator by first of all stating some important points. Before calculating the Zig Zag Indicator, we should take the following into consideration
First of all select the starting point which could be either swing low or swing high then choose your percentage of price movement
After doing that, you can now identify the next swing low or high which is different from the initial starting point that you choose which is the percentage of price movement
The next thing now will be to draw the starting point linking it to another new point then identify another swing low or high that is different from the new point
The last thing now is to draw the trend line and you can now repeat the new or recent swing low or high
Now I will demonstrate this calculate practically.
Zig-Zag[ HL, change in Percentage = False, Lastextreme = True] , Iff the change in % is greater than or equal to X, we can then determine the Zig Zag
But,
HL = High/Low price or rather the closing price
Change in % = It is the % of the Minimum movement of price
Lastextreme = The extreme price should either be the first or the last inspection to see if the price of the extreme is constant over different time periods
1: Traders can be able to use this Zig Zag indicator to determine and know the direction of a trend and trend reversal
2: The Zig Zag indicator is good and can easily be interpreted because both new and experience traders can use it to carry out technical analysis with ease

2. What are the main parameters of the Zig Zag indicator and How to configure them and is it advisable to change its default settings? (Screenshot required)
The Zig Zag indicator indicator has just two main parameters which are depth and Deviation
Depth: This the point where the lowest level of distance cannot constitute a new lowest or highest point that is different from the previous point with a value which is almost equal to the deviation and the standard value is usually set at 10
Deviation: talking of deviation, traders should know that it is the lowest point where change in price will need to have either a minimum or maximum point from the initial first previous maximum or minimum point before the Zig Zag can now be identified using a new summit and the percentage of this is usually set at 5
How To Add Zig Zag Indicator On A Chart
In other to perform this task, we have to first of all Log in to the official site of tradingview.com
Step1
The chart below consist of a pair of STEEM/USD

Screenshot from tradingview.com
Step2
I will need to first of all go to the top of my chart and click on the fx button

Screenshot from tradingview.com
Step3
I now type Zig Zag in the search box and choose Zig Zag and then click on it. After clicking on the indicator, I now go back to my chart

Screenshot from tradingview.com
The indicator have successfully been added to the chart

Screenshot from tradingview.com
Step1
I will have to click on the custom window of the indicator then when it appears, I now click on setting as shown below

Screenshot from tradingview.com
Step2: Input
The input has a default value of 10 depth and 5% deviation. I will unchange it then remove all the necessary infornation on the indicator by clicking on the square boxes containing the information so as I can be able to view my chart clearly. Thereafter, I clicked on ok button below

Screenshot from tradingview.com
Step3 Style
I will not change any information here
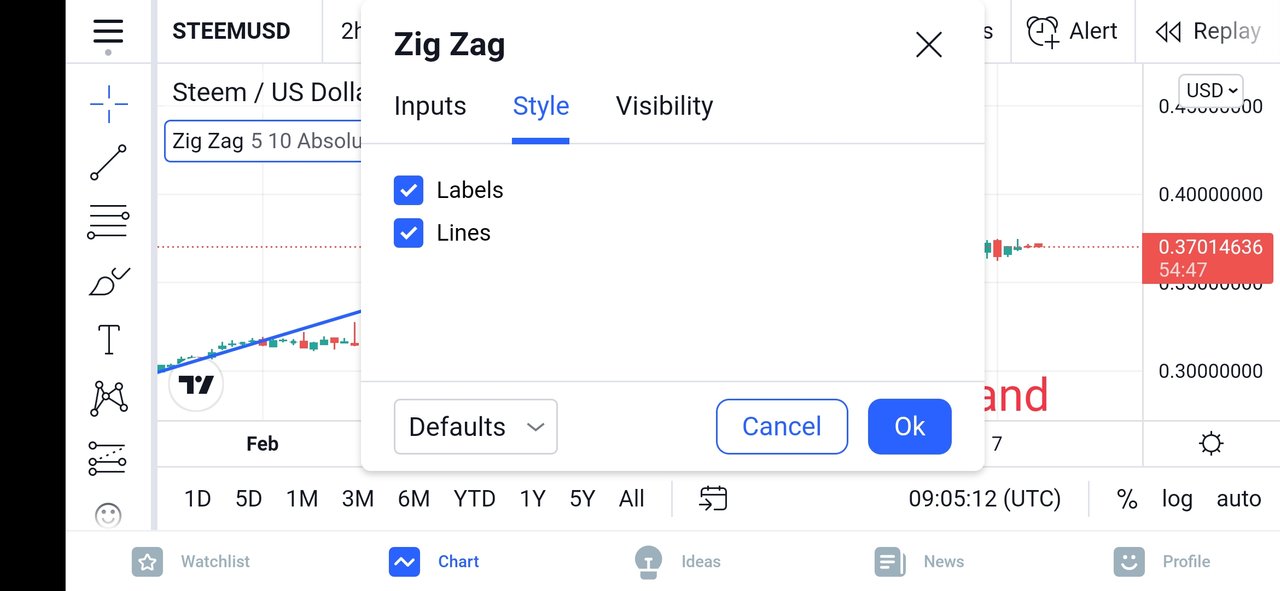
Screenshot from tradingview.com
Step4: Visibility
I will live all the visibility setting at it's default settings

Screenshot from tradingview.com
Now going back to my chart, I see that I have successfully configure it to my taste as seen below

Screenshot from tradingview.com
I think it's advisable to change its default settings at times because not all crypto assets trend thesame in the market. So it's good to change its default settings depending on how trending the market is at that particular period of time. But I will be backing up this question by using charts
Traders should always know that the Zig Zag can work at any chosen time period even including Intradays trading. But this will always depend on the volatile nature of the crypto market. So living it at its default settings is still very good and can still be effective. So for me, changing it's default settings is still good to an extend depending only on the volatility of the market but can be more effective when combined with other indicators.

Screenshot from tradingview.com
From the STEEM/USD chart above, we can see how I have added two Zig Zag Indicators but I have changed their default settings and set one higher and the other one lower. We see how this two indicators varies in the trending Market market
3. Based on the use of the Zig Zag indicator, how can one predict whether the trend will be bullish or bearish and determinate the buy/sell points (screenshot required)
Predicting if a trend is bullish or bearish in crypto trading using the Zig Zag Indicator is what professional traders should know very well so as to be able to determine both buy and sell positions in the market. It's a good thing this indicator is not difficult to be interpreted by traders, so I will be predicting both bearish and bullish trend using this indicator with backups from my chart.
Predicting bullish Trend So as To Determine Buy Order
When ever Zig Zag Indicator is producing both peaks and troughs uptrend, it means the price is in the same direction moving Uptrend. When that is done, the next peak will be higher than the previous one even including the next low as it will as well be higher than the previous low
Once all that criteria is met, we can now determine the buying point and then execute a buy order in the uptrend if we wish. But before executing the buy order, at any point the price produce a next low which is higher than the previous one, we will now take our stoploss just below the closest low

Screenshot taken from tradingview.com
From the BTCUSD chart above, we see how the Zig Zag Indicator is producing both peaks and troughs uptrend and the price is in the same direction to the peaks and troughs. We see how the next peak is higher than the previous one including the next low as it is also higher than the previous low. I had to identify my buying position there by placing a buy order at the point when the price was producing a next low which was higher than the previous one. I then had to take my stoploss just below the closest low
Predicting Bearish Trend So as To Determine Sell Order
When ever Zig Zag Indicator is producing both peaks and troughs downtrend, it means the price is in the same direction moving Down trend. When that is done, the next peak will be lower than the previous one even including the next high as it will as well be Lower than the previous low
Once all that criteria is met, we can now determine the selling point and then execute a sell order in the downtrend if we wish. But before executing the sell order, at any point the price produce a next high which is lower than the previous one, we will now take our stoploss just above the closest high

Screenshot taken from tradingview.com
From the BTCUSD chart above, we see how the Zig Zag Indicator is producing both peaks and troughs downtrend and the price is in the same direction to the peaks and troughs. We see how the next peak is Lower than the previous one including the next high as it is also lower than the previous high. I had to identify my selling position there by placing a Sell order at the point when the price was producing a next high which was lower than the previous one. I then had to take my stoploss just above the closest high
4. Explain how the Zig Zag indicator is also used to understand support/resistance levels, by analyzing its different movements.(screenshot required)
Using a Zig Zag Indicator to understand and determine the level of support and resistance in the market by traders is what they need to know because it's at those level that there is high pressure of buying and selling of crypto assets. Those are also the points where traders can easily make huge profit if executed properly by carrying out a good technical analysis.
To identify this points, traders will need to know that when ever there is a Zig Zag horizontal low, it should be noted that it is a support point and when ever there is a Zig Zag horizontal high, it should be noted that it is a resistance point.
I will discuss this properly below 👇
how the Zig Zag indicator is used to understand support
When a stock price falls below the previous low, we will see how the Zig Zag Indicator will also fall from peaks to troughs. At this level, traders can buy at low price and make profit from it when they sell the asset at high price

Screenshot taken from tradingview.com
From the BTCUSD chart above, we can see how price falls below the previous low as the Zig Zag Indicator also fall from peaks to troughs. Traders can buy at very low price at this points in my chart then make huge profit from it when they sell the asset at high price. That's If only they are patient enough to wait for the asset price to rise and touch a new resistance level
how the Zig Zag indicator is also used to understand resistance
When a stock price rises above the previous high, we will see how the Zig Zag Indicator will also rise from troughs to peaks. At this level, traders can sell at high price and make profit from it
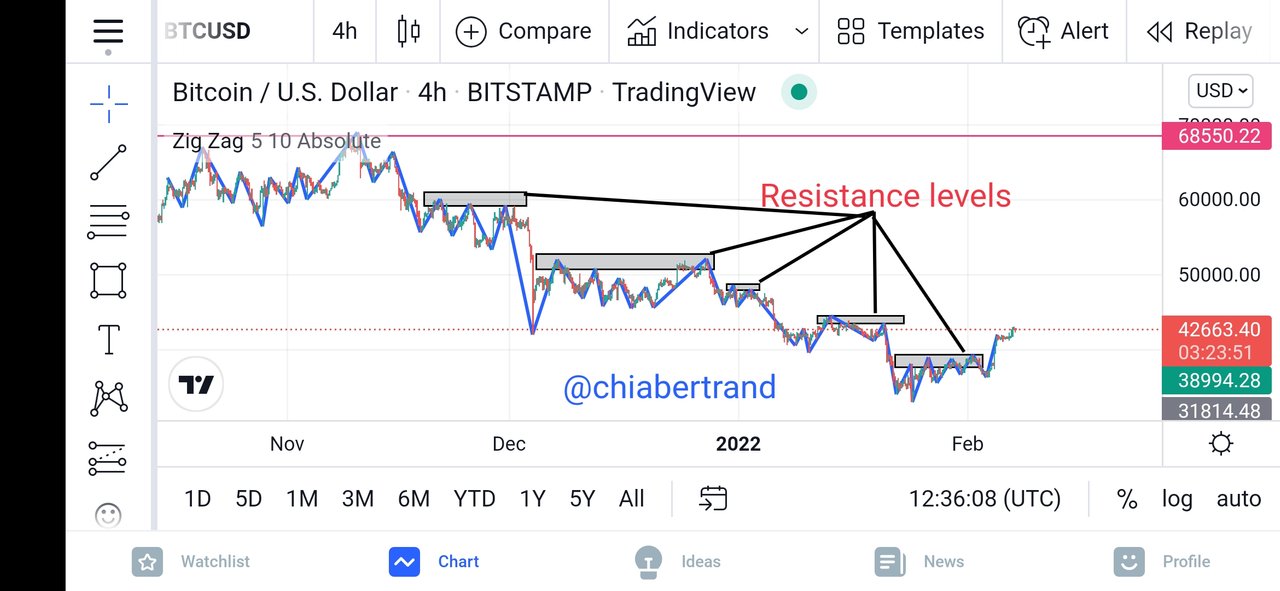
Screenshot taken from tradingview.com
From the BTCUSD chart above, we can see how price rise above the previous high as the Zig Zag Indicator also rise from troughs to peaks. Traders can sell at very high price at this points in my chart then make huge profit from it if they had bought the asset at the previous support before forming this new resistance Levels
5. How can we determine different points using Zig Zag and CCI indicators in Intraday Trading Strategy? Explain this based on a clear examples. (Screenshot required)
Intradays is trading within the day during regular working hours, so in other to use the intradays to determine different points like buy/sell point using Zig Zag indicator together with the commodity channel index(CCI), traders should first of all know that the CCI will always help them to know when there is high selling pressure points in the market or if there is high buying pressure. But let traders should always use the Zig Zag indicator at its default settings of 10 depth and 5% deviation especially if the trader is still a beginner
Again in intraday trading using the Zig Zag Indicator with the CCI, traders will need to determine breakouts at support or resistance level so as to determine the entry points for that trade. This breakouts are usually obtain from Zig Zag peaks or troughs before determine a breakout. Another way to determine this breakouts is to use the Zig Zag at its default settings by taking an advantage to draw lines directly from all the crest points. This points will now act as either support or resistance points where traders can make huge profit by taking perfect entry points in the market
Identifying Buying Signals using Zig Zag and CCI indicators in Intraday Trading Strategy

Screenshot taken from tradingview.com
In other to identify Buying Signals using Zig Zag together with the CCI indicators in Intraday Trading Strategy, traders should take not when ever the last maximum value of the Zig Zag indicator breakout at thesame period when the CCI value surpasses 100 mark. At this point, a buy order entry is the breakout of extreme value of the Zig Zag indicator at that particular point
Identifying Buying Signals using Zig Zag and CCI indicators in Intraday Trading Strategy

Screenshot taken from tradingview.com
In other to identify Selling Signals using Zig Zag together with the CCI indicators in Intraday Trading Strategy, traders should take note when ever the last minimum value of the Zig Zag indicator breakout at thesame period when the CCI value will go below -100 mark. At this point, a sell order entry is the breakout of extreme value of the Zig Zag indicator at that particular point.
6. Is there a need to pair another indicator to make this indicator work better as a filter and help get rid of false signals? Give more than one example (indicator) to support your answer. (screenshot required)
There is no indicator that can be 100% accurate when use alone. So there is always a need to combine two to three indicators on the price of an asset so as to come out with accurate results. Again combining two or three indicators on an asset price usually helps get rid of false signals by giving a precise and accurate signals for traders to take good entry positions in the market.
Combining indicators always eased traders to confirm signals and breakouts in the market but traders should know which types of indicators that can be combined together for effective results because not all indicators can work best together. I will give two examples below
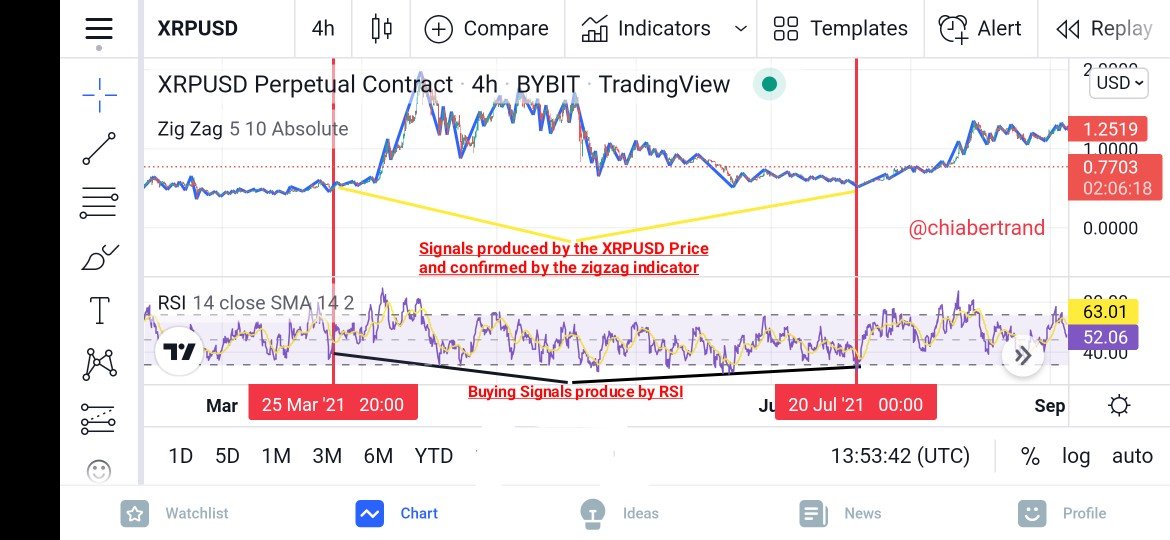
Combining Zig Zag indicator with RSI indicator in other to be able to confirm signals that the market will produce by determine if its overbought or oversold is extremely very good because which I will give a good examples
The RSI indicator consist of overbought points (when above 70 mark) in a Bearish market and oversold (when below 30 mark) in a bullish market. This strategy is determined when ever the RSI indicator signifies when the market is overbought or oversold, the Zig Zag indicator receives the signals from the asset price and confirms it if it is false signals or not. If the signals are not false signals, then it signifies traders that it is a perfect time to invest by taking trade entry positions at those points.
I will demonstrate this practically using the price chart below
For Buy signals in a Bullish market
Screenshot from tradingview.com
From the XRPUSD chart above, we see that any instance when the RSI indicator gives signals of overbought, the Zig Zag indicator will confirm it from the price movement to see if it's true or false signals. Once it's true signals, traders will now able to start investing by taking buy positions produce by both the RSI indicator and the Zig Zag indicator as seen from my chart above. Those are very good entry positions for traders place buy orders in the market
For Sell signals in a Bearish market

Screenshot from tradingview.com
From the XRPUSD chart above, we see that when ever the RSI indicator gives signals of oversold, the Zig Zag indicator will confirm it from the price movement to see if it's true or false signals. Once it's true signals, traders will now able to start investing by taking good selling positions produce by both the RSI indicator and the Zig Zag indicator as seen from my chart above. Those are very good entry positions for traders place a sell orders in the market
The Moving Average (MA) indicator is quit similar with the Zig Zag) Indicator since both signals a change at any moment the price makes a change in the market but using only the Zig Zag Indicator on our chart will normally give less accurate results than combining and reinforcing it with Moving Average indicator which will give greater outcome which is more accurate.
Using just the Zig Zag indicator, a lot of noise may be generated in the market especially when the market is trending at a high rate but combining it with a Moving Average indicator, trading signals will be more precise especially when the two indicators Cross each other as signals will now be generated with less delayance. This usually give a more dynamic system where the price of the asset will be varying with respect to the trend of the indicators.
From here, little or no false signals will be generated since the trader will be able to get rid and filter out any false signals produced in the market. At this stage, it's clear that traders can easily filter out any false signals with the help of this two indicators because they give double confirmation of signals even if it is positive or negative.


Screenshot taken from tradingview.com
From that two charts above, we see how the moving average indicator has helped in strengthening the signals produced by the Zig Zag indicator because the point where both indicator cross each other as i have indicated on the chart for both cases of bullish and bearish movement. We can also see that we can filter out false signals very easily just by looking at the two indicators. This analysis help us to came out only with positive signals hence leading to accurate results
7. List the advantages and disadvantages of the Zig Zag indicator:
In this section, I will giving the pros and cons of the Zig Zag indicator because no matter all the advantages I had earlier mentioned, it definitely also have few disadvantages just like a other technical indicator.
| Advantages of Zig Zag indicator | Disadvantages of Zig Zag indicator |
|---|---|
| Zig Zag indicator is very easy to use and determine the trend of an asset | This indicator is never 100% accurate and can give out more accurate prediction when combined with other indicators |
| Zig Zag indicator is highly receptive to the price of an asset hence reacting fast so as to help traders determine trend reversal | since this indicator is highly reactive to the price of an asset, it may generate so many false signals in the market when perfect analysis is not carried out |
| The Zig Zag indicator is very simple to use both by pro or beginners since it represent a single line on the chart | This indicator is not very good for high volatility in a crypto market because i usually react very fast with price by generating to many false signals in a crypto market |
So far, i have been able to give a detailed explanation of the zigzag indicator, it's uses and how how to calculate it. I also showed how it is configured and it's possible parameters
We have also seen how this Indicator is very suitable in determine trend directions and trend reversal. Base in price crossing strategy, we have seen how the indicator can be use to determine both bullish and bearish movement and we saw how both the moving average indicator and RSI indicator help in strengthening the signals produced by this Zig Zag indicator.
We also saw that this indicator have pros and cones because it can never be 100% when use alone to determine trend directions and trend reversal
Thanks so much Professor @kouba01 for this wanderfull and beautiful lectures because I have been able to grabbed so much knowledge from trading Using Zig Zag Indicator
CC
@kouba01