Starting Crypto Trading - Crypto Academy / S6W1 - Homework post for pelon53.
Image designed by me on Snappa.
Introduction.
This is professor @pelon53's first class this season and I'm hoping to learn about crypto trading. Prof's lecture is based on fundamental and technical analysis, support and resistance levels as well as the Japanese candlestick and its patterns.
I would like to present my entry to the task given.

In Your Own Words, What Is Fundamental Analysis? Do You Think It Is Important For A Trader? Justify The answer.
What Is Fundamental Analysis?
Fundamental analysis is the type of cryptocurrency analysis that has to do with understanding the information of an asset. Such information include; the blockchain and its asset's goal, use case, the team, users and investors and potential scams.
Fundamental analysis is mainly done to understand and determine if an asset is a viable or good investment opportunity. By determining if the asset has been undervalued, oversold, overbought or overvalued, is a way to determine if the asset is a good or bad investment.
By determining these, investors have better chances of identifying the best possible trade entry and trade exit positions. When I say an asset is undervalued I mean its current price is lower than its expected price and when I say an asset is overvalued I mean its current price is more than its expected price.
To get the best out of fundamental analysis, there are certain topics under which fundamental analysis is put under. They are analysis of the asset based on on-chain metrics, metric analysis and project analysis.
Project analysis of fundamental analysis has to do with the progress of the project, coin or asset. What usually spells out what a project is about is its whitepaper. From this whitepaper provided by the project, fundamental analysis can be done. Potential investors can identify the team of the project and look to identify if any of the members has ever been involved in a scam or failed crypto scam. If no member has been involved in a scam it means the project is likely legit but if a member has been involved in a scam or a failed project for whatever reason, it is necessary to reconsider.

The image above is the whitepaper of btc.
The whitepaper of the project also helps us in fundamental analysis by giving us information on the use cases and competition. The crypto world is a huge one which means that there are going to be projects that have similar characteristics or even do the same thing. It is necessary to get the use cases which then informs the user on what the project is about. With this you can compare the project to its available competition and determine if it is the best for you.
The crypto world is highly volatile and as most of us are aware can be influenced by the emotions of investors and asset holders. With this in mind, the whitepaper can help you gain information on how the project had its initial distributed. Should majority of the token be in the hands of a small group of people, it is quite risky or alarming because they can affect the market when they sell the assets. However, if a large group of people holds the tokens it is safer to invest in.
On - chain metrics is another category of fundamental analysis that deals with the information the project has made public. This information can be obtained from the official website of the project or blockchain.
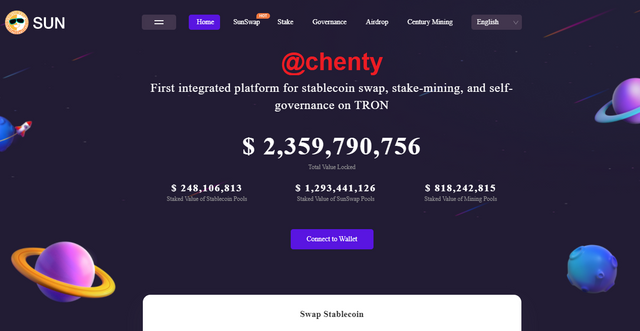
The image above is the official website of sunswap.
On - chain metrics can include the number of transactions the project has made since its introduction which is known as transaction count. It also involves the total value of the transaction count and their active addresses. The number of active addresses is carefully looked at to confirm that the transactions haven't been made by a single investor.
Security is very important when it comes to money and so it is necessary we understand the level of security of a project before we invest. Security can be determined by on - chain metrics fundamental analysis. This can be done by analyzing the hash rate provided by the project on its website.
Financial metrics another of the fundamental analysis category deals with market capitalization, liquidity, trading volume, maximum supply and total supply. Market capitalization helps the users to identify the current value of an asset and also the cost of every unit of the asset. The liquidity of the asset helps us to determine how easily it can be traded.
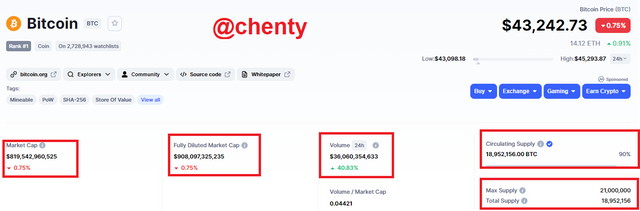
The image above is of btc price statistics that shows some of the financial metrics like max supply.
Some assets have a limited supply while others do not. This can somehow play a part in the growth of the asset so it's important to know if its maximum supply is supposed to be limited or unlimited.

Importance Of Fundamental Analysis To The Trader.
In response to the question, my answer is yes, fundamental analysis is good to traders for the reasons below;
Fundamental analysis helps users determine the security of the asset and protect investors from scams.
It helps users identify the future of the asset by determining the competition and use cases.
Fundamental analysis helps users determine how much an asset is undervalued or overvalued in turn determining its intrinsic value.
Helps traders determine if assets are limited in supply and how much of it is in circulation.
It can help traders find good trade entry and exit points.
Explain What You Understand By Technical Analysis And Show The Differences With Fundamental Analysis.
What Is Technical Analysis?
Technical analysis the type of analysis which involves traders making use of technical indicators, historical charts and patterns to study the trends of assets. It is used to determine if an asset is in or would be in an uptrend ( bullish run) or a downtrend (bearish run).
Technical analysis was introduced in the 1800s by Charles Dow. It is now used with the technical tools or indicators to identify price patterns. Technical analysis with the use of indicators can be easy or difficult. This can be as a result of your choice of indicator used.
Technical indicators have been built and developed in cryptocurrency trading websites like tradingview and fxtm. Tradingview is the most popular trading website and it houses several indicators to aid in cryptocurrency analysis.
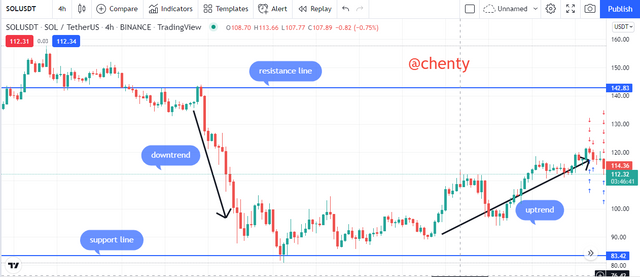
Like prof @pelon53 has explained to us about support and resistance levels, it deals with identifying support and resistance levels. It also deals with market breakouts, price changes, among others. The price patterns displayed by the asset's chart is a very important factor in the analysis. Support and resistance levels can be identified using the Japanese candlestick.
The crypto market like the stock market is controlled by supply and demand. This deals with human behavior and so some indicators have been made to cater for this.
Aside the use of those emotion specific indicators, the other indicators are influenced by the emotions or behaviours of traders.
The fear and greed index indicator is an example of the emotion specific indicators. When investors are greedy, the market is bullish but when traders are in fear, the market switches to bearish trends.
A pattern is identified in a cryptocurrency chart when there's a line that connects common price points over a certain period. The sharkfin pattern is normally a regular or inverted V shape pattern when which occurs when there's a sharp reversal in market trend. Other patterns are the triangle patterns.
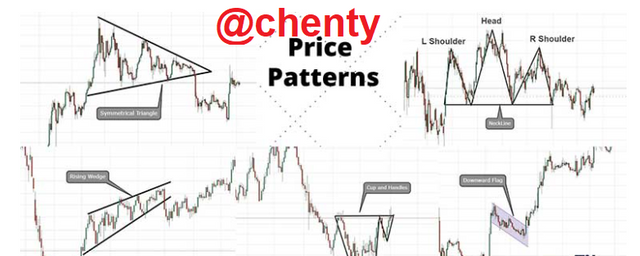
Like already stated, the asset charts display price patterns and so technical analysts use patterns in the analysis of some analysis. These patterns are not "indicators" but just technical trading techniques. The Sharkfin pattern that forms a normal and inverted V shape when there is a sharp reversal in market trend is a notable example.
Technical analysis is done to determine if the strength of market trends strength can be continued. In view of this, analysis involving the use of indicators like the ADJ are used necessary.
Technical analysis uses history and so technical analysis is done by analyzing historical data, charts, among others. It is also believed that the market moves in trends and so these patterns and indicators designed for use are based on market trends.
Trend lines are very important in technical analysis. They are drawn to indicate the direction of the market. An upward line indicates an uptrend and vice versa.
Importance Of Technical Analysis To The Trader.
Technical analysis provides traders with tools to identify price trends.
The use of historical data and similar patterns in the current market when identified can be used to make profits.
Technical analysis helps traders analyze assets on different timeframes.
Differences Between Technical And Fundamental Analysis.
| Technical Analysis | Fundamental Analysis |
|---|---|
| Technical analysis relies on too many assumptions | Fundamental analysis relies on less assumptions |
| Technical analysis is used for short term investments | Used for long term investments |
| Technical analysis uses charts | Uses news, project whitepaper, among others |
| More difficult to use by literates because it requires some technicalities | Easier to use by literates |
| Used to determine the best trade entry and exit time | Used to determine undervalued and overvalued assets |
| Traders use it to predict future prices of crypto assets | Traders use it to analyze assets based on expected value |
| Less time consuming | Consumes more time |
In A Demo Account, Execute A Sell Order In The Cryptocurrency Market, Placing The Support And Resistance Lines In Time Frames Of 1 hour And 30 Minutes.
For this task, I will be using my tradingview paper trading demo account.
- Visit tradingview and click on chart.
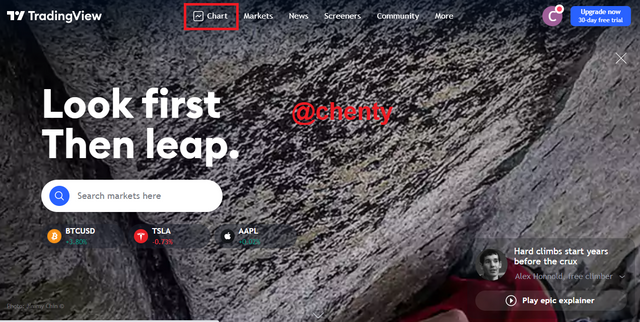
- Chart is launched. Select a crypto chart to use. I decided to use SOL/USDT.
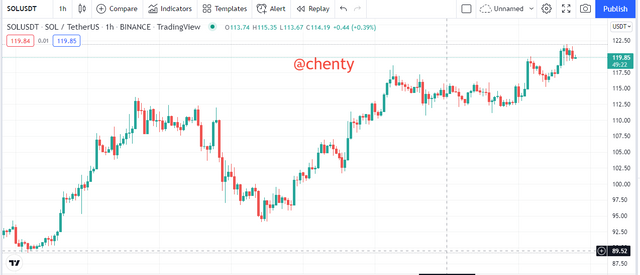
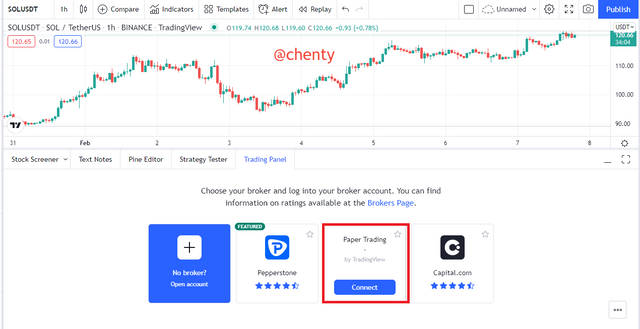
- Click the show panel tab at the bottom of the screen.
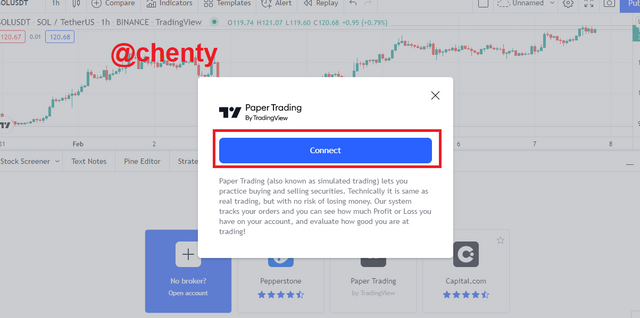
- Select paper trading and click on "connect".
- Click on "Connect"
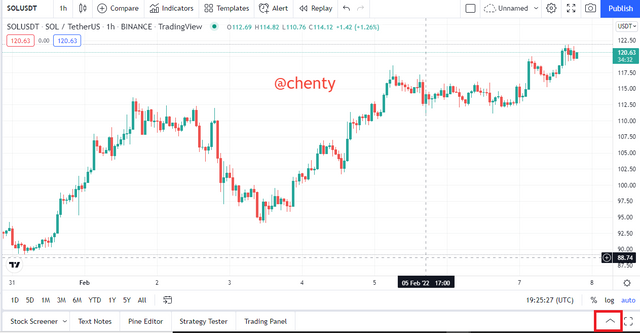
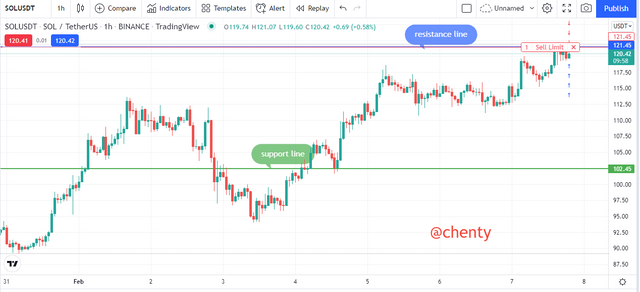
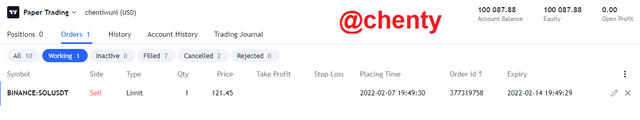
Sell Order For A Time Frame Of 1 Hour Showing Support And Resistance Lines.
In the 1 hour time frame of SOL/USDT, I identified the resistance level at $121.45 and the support at $102.45. I then executed my sell limit trade order at $121.45 as shown below.
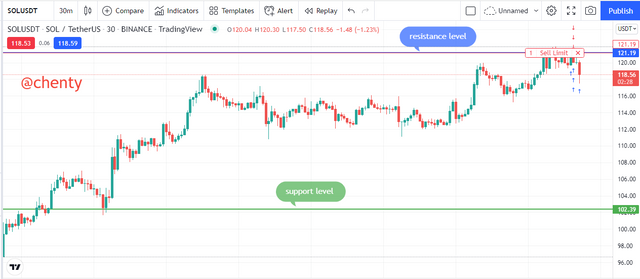
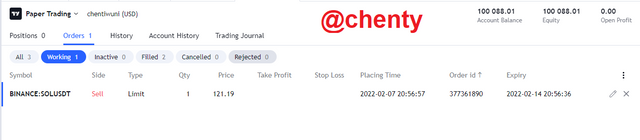
Sell Order For A Time Frame Of 30 Minutes Showing Support And Resistance Lines.
In the 30 minutes time frame of SOL/USDT, I identified the resistance level at $121.19 and the support at $102.39. I then executed my sell limit trade order at $121.19 as shown below.
In A Demo Account, Execute A Buy Order In The Cryptocurrency Market, Placing The Support And Resistance Lines In Time Frames Of 1 day and 4 hours.
I will be using the SOL/USDT pair for this task as well.
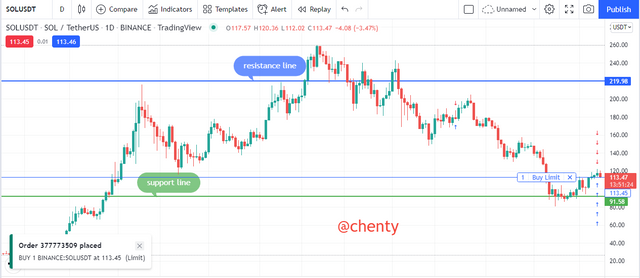
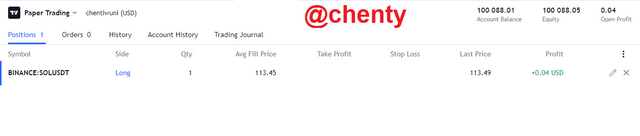
Buy Order For SOL/USDT Showing Support And Resistance Lines In Time Frame of 1 Day.
In the 1 day time frame of SOL/USDT, I identified the resistance level at $219.98 and the support at $91.58. I then executed my buy limit trade order at $113.45 as shown below.
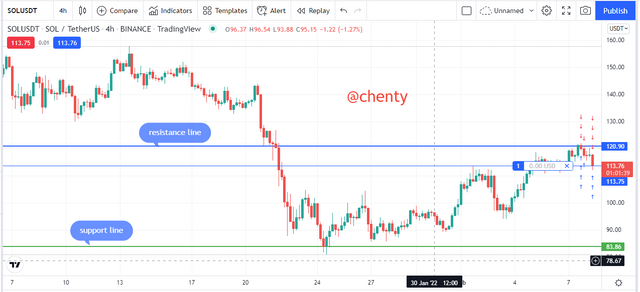
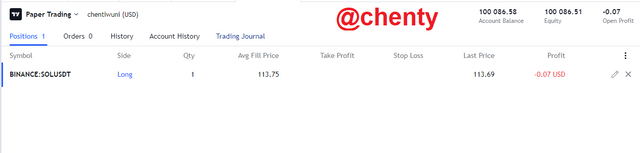
Buy Order For SOL/USDT Showing Support And Resistance Lines In Time Frame of 4 hours.
In the 4 hour time frame of SOL/USDT, I identified the resistance level at $120.90 and the support at $83.86. I then executed my buy limit trade order at $113.75 as shown below.
Explain The “Hanging Man” And “Leaking Star” Candlestick Patterns. Show Both Candlestick Patterns On A Cryptocurrency Market Chart.
What Is The Hanging Man Candlestick Pattern?
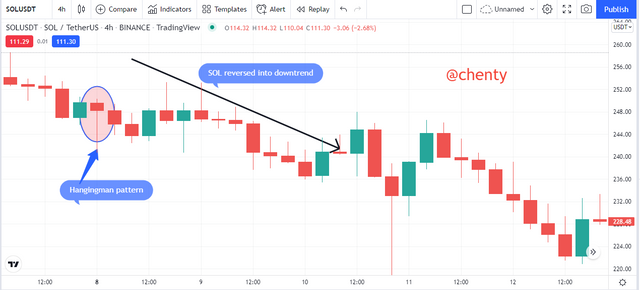
The hanging man pattern is a kind of candlestick pattern that warns investors and traders of an incoming possible bear trend or downtrend. It appears at the top of an uptrend.
To identify a hanging man pattern, two things must be met;
The market asset should be in an uptrend and
The candle should have a small real body and a much longer lower shadow that is about two times of the real body.
When these are met, it indicates a hanging pattern which can then be interpreted. We know that us investor and crypto traders influence the market based on our emotions. When when are greedy and purchasing an asset, it's in an uptrend and hence we become investors but when we lose that strength and traders take over the market by selling the assets, the asset reverses into a downtrend.
This trend reversal is identified by the hanging man pattern when appearing at the top of the uptrend just when the uptrend is coming to an end. You can then take your trade decision when you observe this. It's good to confirm with other indicators since no single analysis is 100% accurate.
Like I already stated, the shadow of the pattern should be about two times longer than the real body. The longer the lower shadow, the stronger the trend and the more accurate the pattern.
The image below shows the Hanging man pattern.
What Is The Leaking Star Candlestick Pattern?
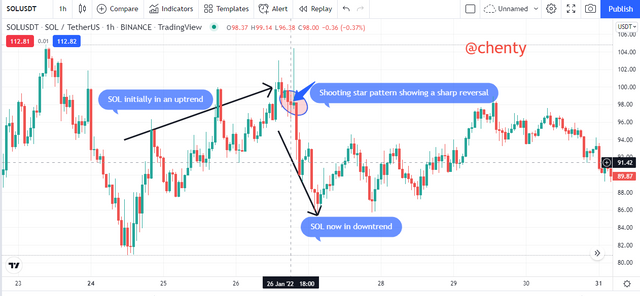
The Shooting star candlestick pattern is a kind of candlestick pattern that warns crypto traders and investors of a possible stop in uptrend continuation and the start of a downtrend.
It is identified by a small real body and much longer upper shadow appearing at the top of a uptrend. The shooting star appears after series or a continued price gains when the investors are not able to keep the asset rising. It appears as a price reversal into a bear trend.
The price of the asset drops back to the open price and possibly drop further when the shooting star pattern is formed.
To identify a shooting star pattern, two things must be met;
The market asset should be in an uptrend and
The candle should have a small real body and a much longer upper shadow that is about two times or more of the real body.
The image below shows a shooting star.
Conclusion.
I would like to say thank you to professor @pelon53 for this very educative lecture on starting crypto trading.
Fundamental analysis is an analysis type used predominantly by long term investors to determine if an asset or project is a good investment opportunity. It uses on-chain analysis, project analysis and financial metrics which are used to determine a number of things like asset security, total supply of asset, among others.
The technical analysis on the other hand is used predominantly by short term investors to determine the future prices of assets. It uses charts of assets to determine the possible best trade entry and exit points as well as the asset's future.
Through the lecture, I have learnt about support and resistance lines that are used more in technical analysis, the shooting star and hanging man candlestick patterns. These patterns are both used to warn investors and traders of a possible trend reversal into a bearish cycle.
The hanging man is signaled by a candlestick with a small real body and a very long lower shadow where as the shooting star is signaled by a small real body and very long upper shadow.
Thank you.
Upvoted! Thank you for supporting witness @jswit.