Steemit Crypto Academy Season 4 - Homework Post for Task 10
1a) Explain the Japanese candlestick chart? (Original screenshot required). b) In your own words, explain why the Japanese Candlestick chart is the most used in the financial market. c) Describe a bullish and a bearish candle. Also, explain its anatomy. (Original screenshot required)

The lesson today, places understanding on candlesticks and their patterns, including their anatomy and I hope to express my understanding of the assignment through this assignment.
(1.)Explain the Japanese candlestick chart? (Original screenshot required).
In the quest to trade and buy crypto currencies and be successful in them, it's necessary the components of market analysis and here we understand candlesticks to be the major basis of it.
The Japanese candlestick had its ancient basis from a Japanese cereal trader, Munehisa Homma in the 18th century since he devised this means as a measure of understanding the effect of market forces (demands and supply) on his his rice trades and since then it's been a great measure of trade movements.
The Japanese candlestick charts could be seen as a view or pattern of financial charts that is meant to show the trend of prices of a crypto currency or even any other financial security.
We must understand too that each candlestick, shows a financial period, be it a day, a month, or even a year.
The Anatomy of a Japanese candlestick should be well emphasized too as it explains majorly, the functions and even the analysis , portrayed by a candlestick.
A candlestick has its composition, of four major parts excluding its shadow.
They include the High, Open, Close and the Low
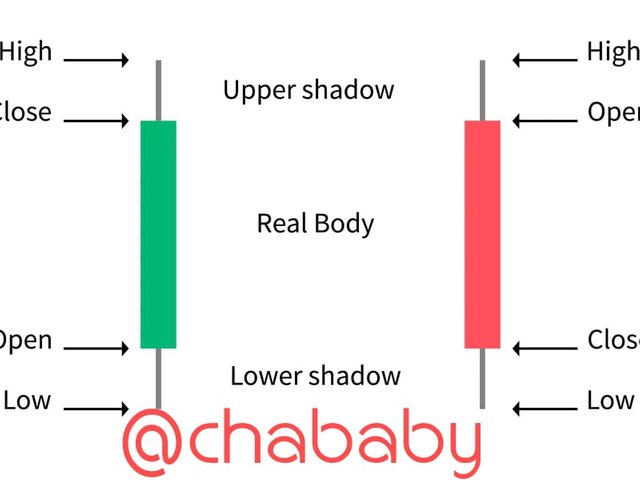
source
- The High explains the apex and ultimate price, the asset has gotten to within the particular period it's been analyzed for
- The Open defines the point at which price begins to move, this entails the value at which price begun to fluctuate from before if finally gets to its close position
- Close : A candlestick close, shows the final point price rests at in a particular period's end.
It connotes the final point price rests before the market period closes - Low: As its name implies, the low price shows the least and minimum price, a crypto asset fell to in a market season.
The Shadow of a candlestick is also an essential part of it as, it shows all the movements of price in places that they didn't rest in or stop.
b) In your own words, explain why the Japanese Candlestick
The Japanese candlestick, is the most used in the market, because it covers a comprehensive and detailed analysis of the position of financial assets.
This explains that they provide the trader with the necessary trading information needed as to know when to place trades and mostly in times of marking support and resistance levels hereby enhancing market performance
They are very essential in decision making via buying, selling and trading of financial assets
c) Describe a bullish and a bearish candle. Also, explain its anatomy. (Original screenshot required)
A Bullish Candle :
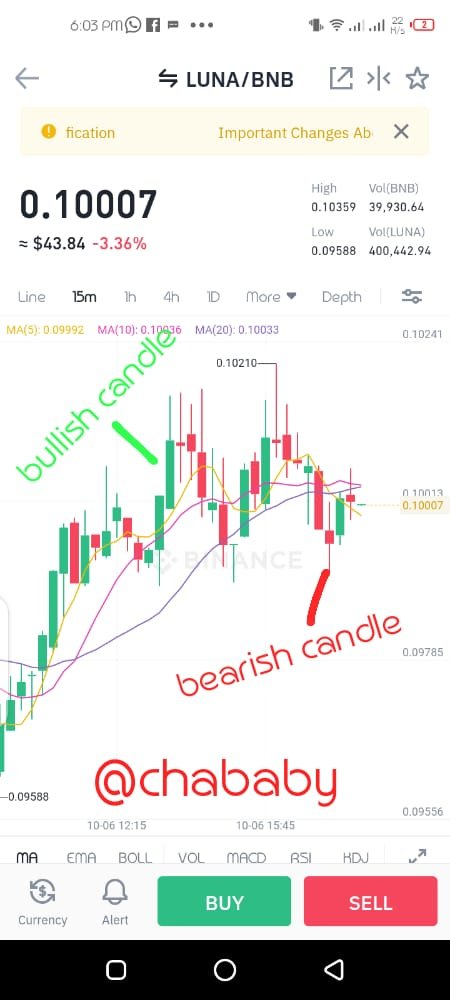
A Bullish Candlestick pattern could be seen as a green candlestick that closes at a higher price level than the former period's open price level.
The Bullish Candle, aims to create awareness amongst traders that the market is about to get Bullish (there is an uptrend) after a former decline in prices.
This candlestick screams the term "" The bulls are here " since a Bullish candle would always represent an increase in the price level of financial assets.
The anatomy of Bullish Candle include :
They include the High, Open, Close and the Low
- The High explains the apex and ultimate price, the asset has gotten to within the particular period it's been analyzed for
- The Open defines the point at which price begins to move, this entails the value at which price begun to
fluctuate from before if finally gets to its close position - Close : A candlestick close, shows the final point price rests at in a particular period's end.
It connotes the final point price rests before the market period closes - Low: As its name implies, the low price shows the least and minimum price, a crypto asset fell to in a market season.
 screenshot from binance
Bearish candle
A bearish candle could be seen as a red candlestick, closing at a lower price level than than the previous day's open price level. The bearish candle shows a decline and fall in the price level of prices (bearish /downtrend) just after a Bullish trend in prices.
The bearish candle confirms the intrusion of bears (downtrend factors) into the market, hereby reducing the market value of financial assets..
The anatomy of Bearish candle just like the Bullish one includes the High, Open, Close and the Low positions
The High explains the apex and ultimate price, the asset has gotten to within the particular period it's been analyzed for
The Open defines the point at which price begins to move, this entails the value at which price begun to fluctuate from before if finally gets to its close position and in a bearish candle, the open is depicted by the top of the candle unlike the Bullish one where it's at the end of the candlestick.
Close : A candlestick close, shows the final point price rests at in a particular period's end.
It connotes the final point price rests before the market period closes and its at the end of the candlestickLow: As its name implies, the low price shows the least and minimum price, a crypto asset fell to in a market season.
CONCLUSION
It was an amazing lecture and honestly I learnt a lot about the candlestick chart and why it is the most used in the financial market, I also learnt about the anatomy of the bullish and bearing candlestick pattern. Thank you all for reading my post
Best regards
@