TIB: Today I Bought (and Sold) - An Investors Journal #458 - Gold Mining, Emerging Markets, US Real Estate, US Industrials, US Banks, South Korea, Bitcoin
Talk about flip flop from panic on Friday to a move up on Monday. Weekend away had me not looking too closely. My trade action leans to the hedging side with profits in gold mining redeployed in gold mining

Portfolio News
Market Selloff/ Rally
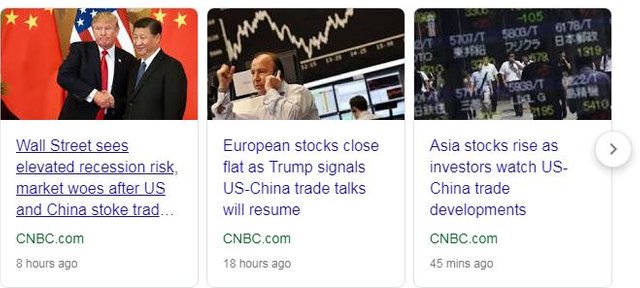
It feels like a war of words all about nothing - Friday words of war drags prices down
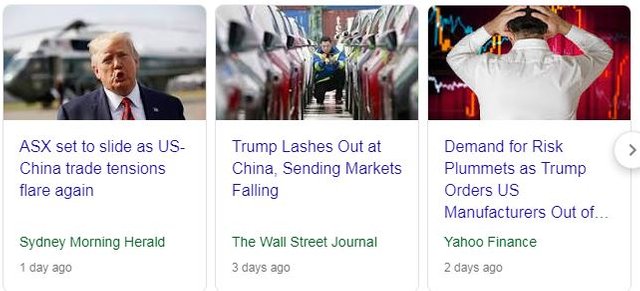
and Monday words make it a little better again.
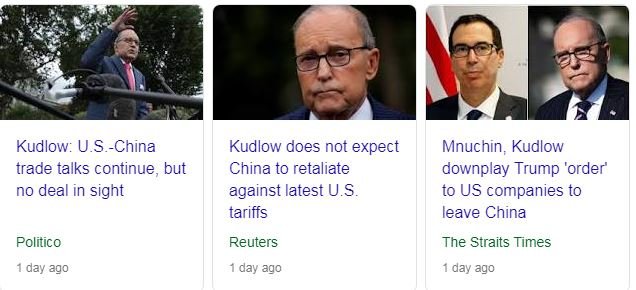
The truth is the Punch and Judy show is on the go again with the Kudlow/Mnuchin show on at the the weekend and on Monday pacifying the markets.
I listen to the Trump words. This is what I see. He just says what he thinks will sound right at the time. There does not appear to be a thread of thinking that holds it all together. Either the Chinese are ready to talk or they are not - it has to be one or the other - not both.
For sure what the Punch and Judy show has done is take the attention off the proceedings at Jackson Hole.

The commentators and especially Bank of England Governor, Mark Carney, seem to be of the view that there is not a lot central bankers can do as the problem is a trade problem and not a money problem. The trade problem man can fix it himself - or not get re-elected.
Biggest mover for the weekend flip flop is the Chinese Yuan. It looks like gloves came off
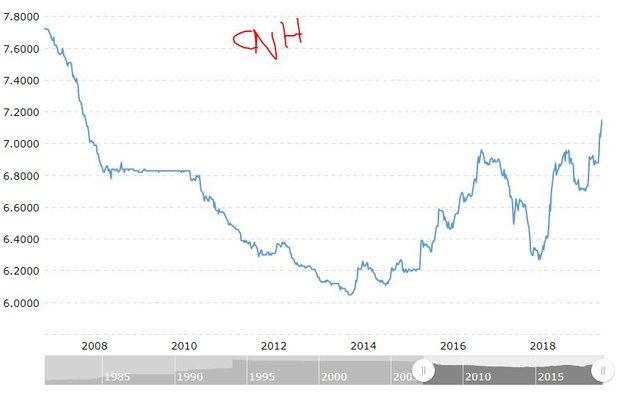
https://www.macrotrends.net/2575/us-dollar-yuan-exchange-rate-historical-chart
Price weakens to a level not seen since January 2008, before the Shearson Lehman collapse heralded the Global Financial Crisis. This move is giving me a trade management challenge on the one options trade I am holding which is now well ahead of 100% profit. Do I close and take the money or do I try to eke out some more?
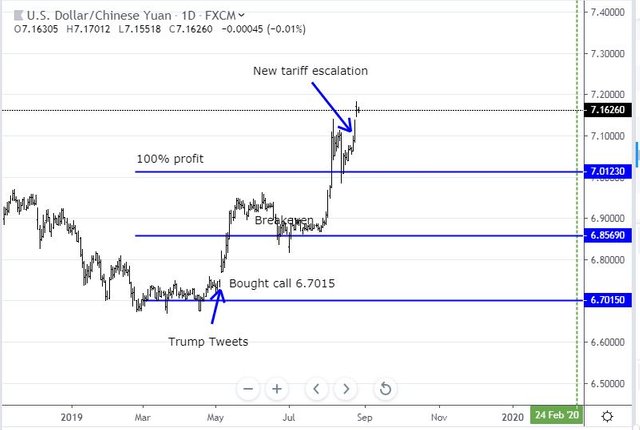
This trade is hedging two stock positions I am holding in Chinese stocks - one is 6.25% under water (Agricultural Bank of China - 601288.SS) and the other (Ping An Insurance - 601318.SS) is 38% profitable. The currency hedge is sure working the way it was designed. That probably answers the question. Do I open another is the next question or just wait to expiry?
Bought
iShares MSCI Emerging Markets ETF (EEM): Emerging Markets Index. The talking heads are asked every interview, "What to invest in in this low yield world?". One answered Emerging Markets (including China) but maybe not quite yet. A long dated (January 2021) one strike out-the-money call option was my small punt.
VanEck Vectors Gold Miners ETF (GDX): Gold Mining. Deployed portion of proceeds of Yamana Gold sale into a March 2020 strike 30 call option. This adds to the holding in this portfolio of December 2019 strike 30's. With trade price at $29.64 wanted to give a little more time for the trade.
In my other portfolios, I went right out in time and bought January 2021 strike 30 and 34 call options. Strike 30 is one strike out-the-money. The updated chart is a bit busy as I have quite a few trades running. The new trades are shown as purple rays - the bought call 30 extending to new expiry (vertical purple dotted line) and the bought call 34 extending past the right margin to 2021 with its breakeven above.
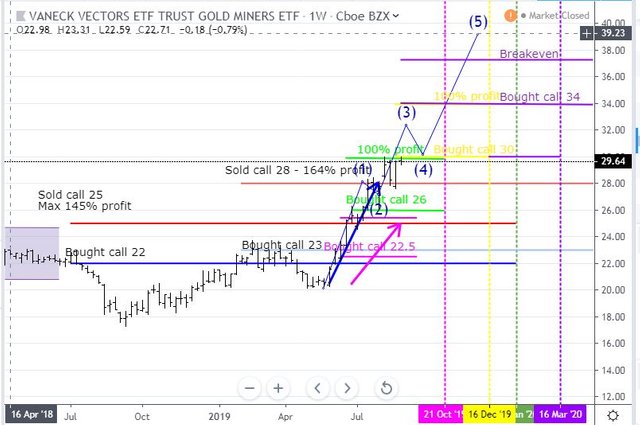
Price seems to be following the steepness of the Elliot Wave trajectory I pasted in in June. It has had two small pullbacks earlier than the waves would suggest which means it could well top out before reaching 5. The steepness and the noise around trade and the Fed is what these trades are about. Hence being open ended (i.e., not a spread) and being well out-the-money. That call 34 is a real blue sky trade aiming for the top of the wave with a lot of time in hand.
Sold
Yamana Gold Inc (AUY): Gold Mining. Closed out January 2021 2/3 bull call spread for 114% profit since June 2016. Deployed portion of the proceeds in a December 2021 strike 4.5 call option. With price at trade time at $3.62 this is well out-the-money. In this portfolio, I am already holding a 2.5/4 strike bull call spread - hence going above that sold leg for this trade.
I did calculate the relative price differences on options on Yamana vs the Gold Mining ETF (GDX). GDX was priced more tightly BUT I do like the small ticket size on Yamana as the strike price was only $4.50 - 1 contract cost only $75 = the price of dinner out for two.
Quick look at the chart which shows the new trade as a purple ray with its 100% profit level above. The replaced trade is shown as the pink rays.
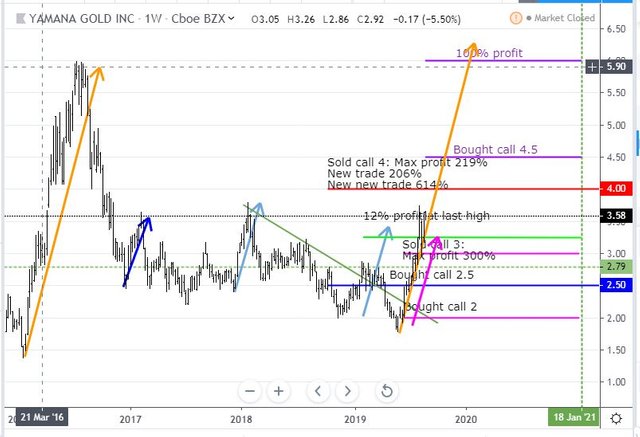
I drew in the ochre price arrow some time ago BUT was not really bold enough to clone it across. Price is holding to that steepness so I have now done that. That is the basis of the new trade - open ended to get the full run. Of course I can improve the profit profile of the trade by selling a call somewhere between $4.50 and $6.00
Shorts
iShares U.S. Real Estate ETF (IYR): US Real Estate. One of the talking heads suggested that the long real estate trade was overbought - I was heading the other way. Bought November 2019 strike 91 put option against Monday opening price of $91.08. Price had tested up to $92 and was retracing. In TIB455, I outlined a trade for an October 2019 92/88 bear put spread which straddles the price range we have seen for 3 cycles. This trade continues that trade idea with one month extra to expiry. The updated chart shows the new trade as pink rays working to the pink vertical line as expiry date.
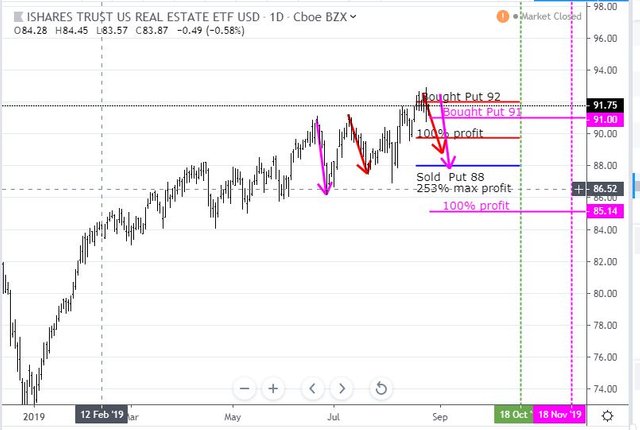
What jumps out for me immediately is the 100% profit level is well below where price has traded. I will add in a sold put on this trade also around that $87 level. I just cannot see price falling that far in the next 3 months - especially as price headed in the wrong direction in the day closing 0.74% higher closer to $92.
Income Trades
Honeywell International Inc. (HON): US Industrials. At last options expiry, I said I would not make any new naked put trades. The big selloff last week gives prices something of a base to work from. Sold a September 2019 strike 150 naked put against an opening price of $156.49. Premium was 1.25% of opening price.
Set up two covered calls on new positions opened last week on Citigroup (C) and iShares South Korea (EWY) for average premium of 0.44% with coverage of 7.7%
Cryptocurency
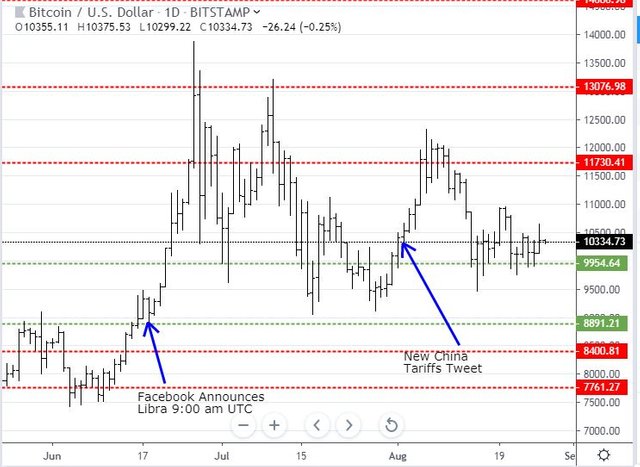
Bitcoin (BTCUSD): Price range for the weekend plus one day was $765 (7.5% of the open). Price respected the support at $9954 twice over the weekend and edged a new high on Sunday. This relatively narrow price move surprised me given the dramatic move weaker in the Chinese Yuan (USDCNH) following the trade war escalation on Friday.
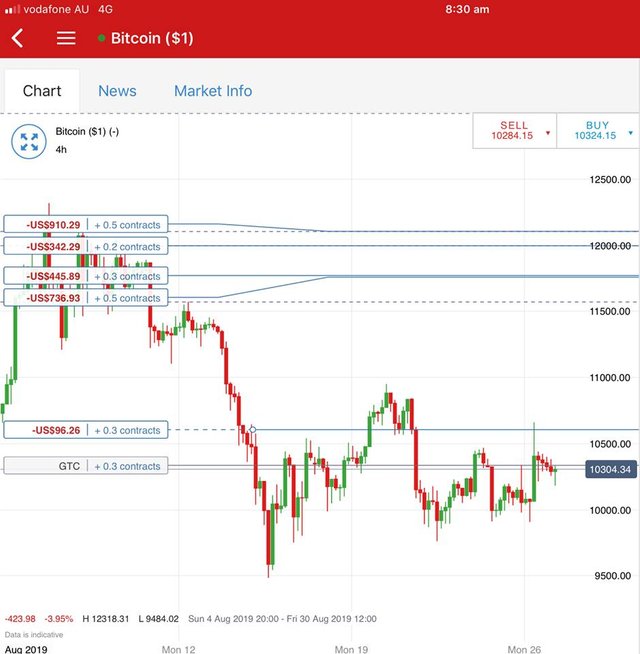
One trade closed out on a spike in price for $470.44 (4.6%) per contract profit. Replaced that contract on a pending order on a 4 hour reversal (labelled GTC).
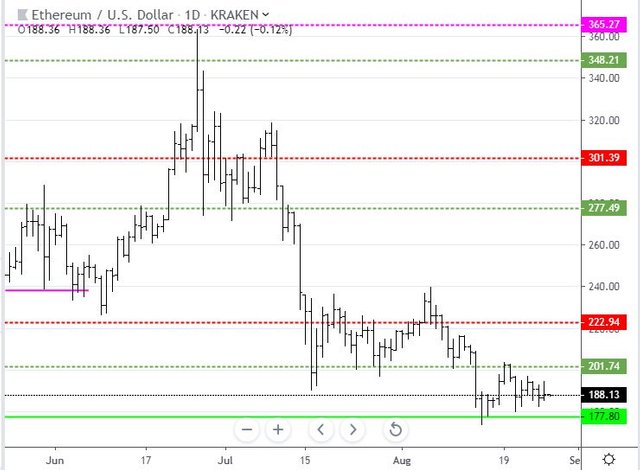
Ethereum (ETHUSD): Price range for the weekend plus one day was $15 (7.6% of the high). Price behaved quite differently with the high traded on Friday and price drifting around in "no mans land" all weekend. It is squeezing into a triangle - hard to tell which way it will break
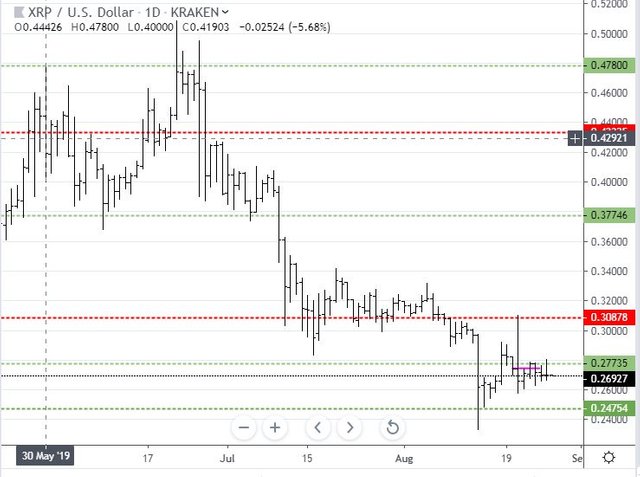
Ripple (XRPUSD): Price range for the weekend plus one day was $0.01752 (6.4% of the open). Price worked mostly sideways under the resistance level at 0.27735 with the low coming on Saturday and the high on Monday. Price did push over the resistance level in Monday trade but closed back where it started the day. Do not be surprised if this turns out to be a a high test long tailed bar testing a level?
CryptoBots
Profit Trailer Bot Three closed trades (1.74% profit) bringing the position on the account to 9.67% profit (was 9.59%) (not accounting for open trades).
New Trading Bot Trading out using Crypto Prophecy. No closed trades
Currency Trades
Outsourced MAM account Actions to Wealth closed out 4 trades on USDJPY, USDCHF, and AUDCAD for 0.54% profits. No trades open
Cautions: This is not financial advice. You need to consider your own financial position and take your own advice before you follow any of my ideas
Images: I own the rights to use and edit the Buy Sell image. News headlines come from Google Search. USDCNH long view chart is credited below the image. All other images are created using my various trading and charting platforms. They are all my own work
Tickers: I monitor my portfolios using Yahoo Finance. The ticker symbols used are Yahoo Finance tickers
Charts: http://mymark.mx/TradingView - this is a free charting package. I have a Pro subscription to get access to real time forex prices
Trading: Binance offers a wide range of coins to trade, tight spreads and low fees if you use BNB to pay https://mymark.mx/Binance
Tracking: Keeping track of your crypto trades is a whole lot easier with CoinTracking.info. Get 10% off all your account upgrades https://mymark.mx/CoinTracking
August 23-26, 2019

Real Estate is definitely primed to be at a top but the challenge is finding some of the purest plays in retail and other weaker sectors.
Posted using Partiko iOS
It is. Might be time to start digging into a few small cap names.
Close that trade, take your profits, look for the next opportunity.
Gold looks like it is on a roll. Gold miners are being dragged along. Do not forget silver which has moved too. I have not looked at silver miners for a while.