TIB: Today I Bought (and Sold) - An Investors Journal #388 - Home Builders, Clothing, US Treasuries, Oil Drillers, Oil Production, Thailand, China
US Markets shrug off their woes for a bit. Profits shifted from Thailand to China and oil to oil drilling. Options action in clothing apparel and homebuilders. And time to bite the bullet and buy US Treasury bonds.

Portfolio News
Market Selloff
I watched US futures open a bit higher - the day ended mixed with some sectors under pressure

The market did like the release of tension surrounding the Mueller report - never mind what the politicians and the diehards like to think. Real pressure points in the markets were felt by financial stocks as yields slid further with the 10 year down to 2.4% which is lower than 3 month Treasuries (and a little higher than the trade I made for a 4 year bond). Against the backdrop of Asian markets, this was something of a relief

Nikkei 225 was down 3% on the day - only 2 stocks in my Japan portfolio went up. China was much the same.
Britain Bumbles
UK Parliament takes control of its own proceedings - isolating Theresa May further.
They will run a series of votes on Wednesday to shape what they can actually agree on. This has long been argued as not a good idea - makes a lot of sense to me - maybe time to get a unified view on what to do.
But it's important to note those votes won't at this stage force the government to do anything, they won't be binding, and the prime minister has indicated she could not, and would not ever support a plan that wasn't in the Conservative manifesto
https://www.bbc.com/news/uk-politics-47701532
Cannabis Carnival
Namaste Technologies (N.V): Canadian Marijuana. Namaste appointed new auditors after PricewaterhouseCoopers quit.

They also applied to court for a Management Trade Cease Order (MTCO) to stop named directors from selling shares on the open market. There will be a delay in finalising annual accounts. These actions are never a good sign as they are normally the tip of a smelly pile of dung.
Bought
Ensco plc (ESV): Offshore Oil Driller. Used proceeds from sale of Talos Energy to open a small position in one portfolio. I am holding it in another. Decision based on prior analysis of financials and not by checking them again. This is what I wrote in TIB101 in June 2017
We talked through the financials in our investing group - it looks like Ensco has enough resources to be one of the survivors.
Too bad I did not check them again. 2018 was a cash flow negative year. While total debt to equity is manageable at 62%, interest cover is not solid. Maybe not a good trade but it is one for the long haul (See TIB80 for a comprehensive walk through on offshore oil rationale).
Xtrackers Harvest CSI 300 China A ETF (ASHR): China Index. Added to my small holding of China A Shares on a big down day for Asian stocks. In TIB272, I wrote
I looked at the charts and decided to buy the ETF rather than work with options. This is going to be a long waiting game to benefit as new industries supplant old industries.
Doing more of the same again - the chart tells the story of a long waiting game for stocks and maybe running out of time for options - maybe time to roll out in time for the 2020 expiries.

Lululemon Athletica Inc (LULU): Clothing Apparel. CNBC Options Action idea ahead of earnings. Analyst downgrade last week knocked the stock back 4%. CNBC team liked strong online growth, solid China sales and improving operating margins (18.2% up from 17.6%).

Image above gratis para uso personal y comercial. No se requiere ninguna atribución
https://creativecommons.org/publicdomain/zero/1.0/
When earnings come along the stock moves a lot and options are expensive. They constructed a call spread risk reversal for April 2019 at 145/155/135 for $0.20. I looked at options pricing before market open. I also saw that US market futures were looking for a higher open on the back of the Mueller enquiry result. I wanted a cash neutral trade and more leeway on the downside. I bought the 144/152.5 bull call spread (giving up some upside) for $3.48 net premium (144% profit potential) and sold a 130 put for $3.76 - getting more leeway. With Friday closing price of $143 this offers 10% leeway. And I got paid $0.28 per contract to put on the trade.
Best part of the trade is price moved up 2.35% and closed at $146.58 and was trading even higher in after hours market. Let's look at the chart which shows the bought call (144) as a blue ray and the sold call (152.5) as a red ray and the sold put (130) as a dotted red ray with the expiry date the dotted green line on the right margin. earnings dates are also shown.

With 3 earnings reports on the chart, we have seen two big moves up (blue arrows) and one down (red arrow). The size of the red arrow explains why I wanted more leeway. Get good earnings and blue arrow scenario will comfortably deliver maximum profit.
SPDR S&P Homebuilders ETF (XHB): US Homebuilder. Homebuilders do better with lower interest rates and have started outperforming S&P 500 since the end of 2018 - see the buy:sell chart

Buy:Sell Chart [Means: Buy the first named stock and sell the second named stock. If the chart goes up the first named stock is outperforming. If the chart goes down the second named stock is outperforming]
One of the big homebuidlers (Lennar) is reporting earnings this week. CNBC Options Action team suggested a short term options trade at the ETF level (even though the ETF contains a lot more than homebuilders - it includes things like Home Depot (HD)). I followed them and bought a June 2019 strike 38 call option for $1.44 (3.8% of strike). Friday close was $37.68 and Monday closing was $38.17. Let's look at the chart which shows the bought call (38), breakeven and 100% profit as blue rays with the expiry date the dotted green line on the right margin

Breakeven is below the last highs and 100% profit is around the October 2018 highs. I have modelled a price scenario from the trading range in mid 2018 - a repeat of that from current levels will get the trade close to 100% profit. That feels doable in 3 months.
Lennar Corporation (LEN): US Homebuilder. Lennar reports earnings this week. Jim Cramer discussed it on Friday in Mad Money - he likes it. One of the Options Action talking heads preferred it compared to SPDR Homebuilders ETF as it is a pure play and is countrywide. I went looking at Call Spread Risk Reversal ideas to give me solid downside opportunity.
I bought the January 2021 47.5/52.5 bull call spread (giving up some upside) for $2.36 net premium (111% profit potential) and sold a 130 put for $2.55 - getting more leeway. With Friday closing price of $47.84 this offers 37% leeway. And I got paid $0.19 per contract to put on the trade. Let's look at the chart which shows the bought call (47.5) as a blue ray and the sold call (52.5) as a red ray and the sold put (35) as a dotted red ray with the expiry date the dotted green line on the right margin.

What I wanted was to get the sold put well below the double bottom price levels. I have modelled price moves on earnings (blue up and red down). A blue arrow price scenario will comfortably take the trade past maximum profit. And that level is below the mid 2018 highs.
USA Treasury 2.75% Bonds With yields falling, I decided it was time to add more fixed interest holdings to my pension portfolio. My sense is we have seen the end of the rising yield cycle for a while. I chose to use US Treasuries rather than Australian bonds as the yield to maturity differential was small (2.25% vs 2.49%) and I think we have more downside to go on Australian Dollar. Expiry is May 2023 which should take us well into the next full yield cycle
Sold
Talos Energy Inc (TALO): Oil Production. Sold February 2021 Strike 42 call warrants for 75% profit since June 2017. Formerly Stone Energy, these warrants were issued when the business exited Chapter 11 administration. With closing price of $25.30, these warrants have some way to go to reach in-the-money if they ever will. This has been a fruitful way to invest in distressed assets.
iShares MSCI Thailand Capped ETF (THD): Thailand Index. Asian shares took a hammering in the Asian session which prompted me to add to my China A Shares holding. I noted that this Thailand ETF had not gone down and I had a small holding (only 45 shares). I rotated them out in favour of China A Shares for 29% profit since June 2016. Uncertainty about the Thailand election was also in the back of my mind.
Cryptocurency
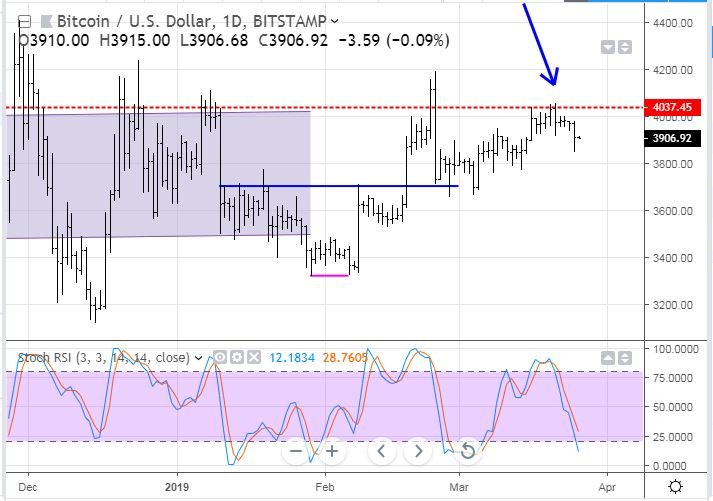
Bitcoin (BTCUSD): Price range for the day was $130 (3.3% of the high). The bearish engulfing bar from March 21 was indeed a reversal. Price tracked lower in a larger move than normal. Now this might feel distressing but the Stochastic RSI momentum indicator is looking somewhat oversold (lower window - not turned yet)
Ethereum (ETHUSD): Price range for the day was $6 (4.4% of the high). Price headed down to test the long term support level and closed just above. It did however make a lower low. Will be watching the Stochastic RSI momentum indicator for signs of a reversal

CryptoBots
Profit Trailer Bot No closed trades
New Trading Bot Trading out using Crypto Prophecy. Trade closed on QSP (1.83% profit)

The chart tells the story of one that got away. Trade had two exit levels at 524 and 525, which were hit just as price rocketed up to touch 570.
Currency Trades
Outsourced MAM account Actions to Wealth closed out 6 trades on AUDNZD, EURJPY, EURUSD for 0.51% profits for the day. Trades open on USDCHF, USDJPY, EURJPY (0.8% positive) are all safe haven trades.
Cautions: This is not financial advice. You need to consider your own financial position and take your own advice before you follow any of my ideas
Images: I own the rights to use and edit the Buy Sell image. News headlines come from Google Search and PuffPot. Yoga image is credited below the image. All other images are created using my various trading and charting platforms. They are all my own work
Tickers: I monitor my portfolios using Yahoo Finance. The ticker symbols used are Yahoo Finance tickers
Charts: http://mymark.mx/TradingView - this is a free charting package. I have a Pro subscription to get access to real time forex prices
Crypto Prophecy provides a useful tool to identify oversold and overbought coins - https://mymark.mx/CryptoProphecy
Trading: Binance offers a wide range of coins to trade, tight spreads and low fees if you use BNB to pay https://mymark.mx/Binance
March 25, 2019

The problem with housing is affordability and interest rates will not go low enough to incentivize more homebuying as the builders themselves have held back on lower cost homes.
Posted using Partiko iOS
Agree. KB Homes results show the power of reducing footprint to improve affordability. If they can do that in California, there is a lot of scope in the rest of the country. Improvement in lumber prices has helped too - BUT work still needed on getting the tariff war with Canada resolved. Labour availability is always going to be an issue while there are strong restrictions non immigration.
Of course, these trades are really set up to be short term through KB Homes and Lennar earnings.